Market Flash Report September 2024

Economic Highlights
United States
- The September employment report came in below expectations with significant downward revisions to job growth in July and August. U.S. employers added 142,000 new jobs to the economy last month, below the 161,000 expectation. The previous two months saw substantial downward revisions. The Bureau of Labor Statistics cut July’s total by 25,000, while June fell to 118,000, a downward revision of 61,000. The unemployment rate ticked down to 4.2%, as expected. However, the “real” unemployment rate edged up to 7.9%, its highest reading since October 2021. Average hourly earnings increased by 0.4% on the month and 3.8% from a year ago, both higher than the respective estimates of 0.3% and 3.7%. Of note, the manufacturing sector shed 24,000 jobs.
- The Federal Reserve (The Fed) began its monetary easing cycle with a 50 bps rate cut at its September meeting. This bigger than anticipated rate cut was fueled by the uptick in unemployment and softening inflation prints. The Fed projects 2-3 additional rate cuts in 2024 and 4 in 2025, bringing down the Fed Funds Rate to a range of 3.25-3.50%. Forecasts for GDP remained in the 2% range for the next few years and inflation was expected to reach 2% in late 2025. The unemployment rate was forecast to end 2024 and 2025 at 4.4%.
- Inflation continues to trend towards the Fed’s 2% target based on The Personal Consumption Expenditures (PCE) Index. The headline PCE Index rose 0.1% M/M in August or 2.2% Y/Y while the Core PCE Index rose 0.1% M/M or 2.7% Y/Y. The headline PCE rate of inflation fell in August versus July, but the core reading was 0.1% higher. August’s Consumer Price Index (CPI) report showed headline Y/Y inflation dropping to 2.5% and core inflation holding steady at 3.2%.
- The ISM Manufacturing Purchasing Managers’ Index (PMI) held steady at 47.2 in September, albeit below the important 50 level that separates contraction from expansion. Prices and employment weakened, but production and new orders strengthened from weak prior levels.
Non-U.S. Developed
- September saw a renewed decline in business activity in the eurozone private sector, according to flash PMI composite data. The fall in output was the first in seven months and was registered amid a sustained reduction in new orders. New business decreased at the sharpest pace since January. The reduction in overall business activity was driven by a deepening downturn in the eurozone manufacturing sector, where production decreased for the eighteenth month running and at the fastest pace so far this year. Although services business activity continued to rise, the latest expansion was only marginal and the weakest since February.
- Inflation in the eurozone fell below the European Central Bank’s (ECB) 2% target last month, boosting hopes for another interest rate cut. Headline inflation fell to 1.8% in August from 2.2% in the previous month and core inflation fell from 2.8% to 2.7%. The ECB cut rates by 25 bps on September 12 and is expected to ease again at their October 17 meeting. Restrictive monetary policy has brought down inflation, but the ECB should be increasingly worried about sluggish growth.
- While the rest of the globe is cutting rates and easing restrictive monetary policy, Japan is one of the few countries focused on tightening policy to counter rising inflation. The Bank of Japan (BOJ) expects the Japanese economy to grow above its potential with an upgraded view on inflation. Private consumption is forecast to increase moving forward. Japan was the last central bank to exit negative interest rates in March, and they are expected to raise rates again in October or November.
Emerging Markets
- In China, policymakers surprised market participants with new measures aimed at stabilizing the economy amid concerns over deflation and slowing growth. After the People's Bank of China (PBOC) unveiled a package of broader than expected policy easing on Tuesday, fiscal policymakers called for stepping up counter-cyclical fiscal stimulus at an off-schedule meeting. The new fiscal package is reported to include a 1 trillion yuan capital injection into top Chinese banks and 2 trillion yuan of special sovereign bond issuance to stimulate consumption and alleviate local government debt issues. Stimulus also included interest rate cuts to mortgages to help turn around the collapsing housing market.
- Economists applauded the bold measures announced and implemented by the PBOC as better late than never, but most believe the stimulus will be insufficient to support a full economic recovery. Additional stimulus may be necessary for the government to achieve its stated growth target of 5% for 2024. Most economists expect GDP growth to come in below the 5% target level.
- The official manufacturing PMI in China increased to 49.8 in September from 49.1 in the prior month. The official non-manufacturing PMI fell from 50.3 in August to 50.0 in September. The smaller company focused Caixin PMIs for manufacturing and services also weakened in September.
- The stimulus measures announced by China resulted in the best week for Chinese equities since 2008. Property stocks rocketed higher by ~50% while the Hang Sang Index increased 13% over the last week. Many investors were short the Chinese markets and this resulted in massive purchases of equities and Exchange-Traded Funds (ETFs).
Fixed Income
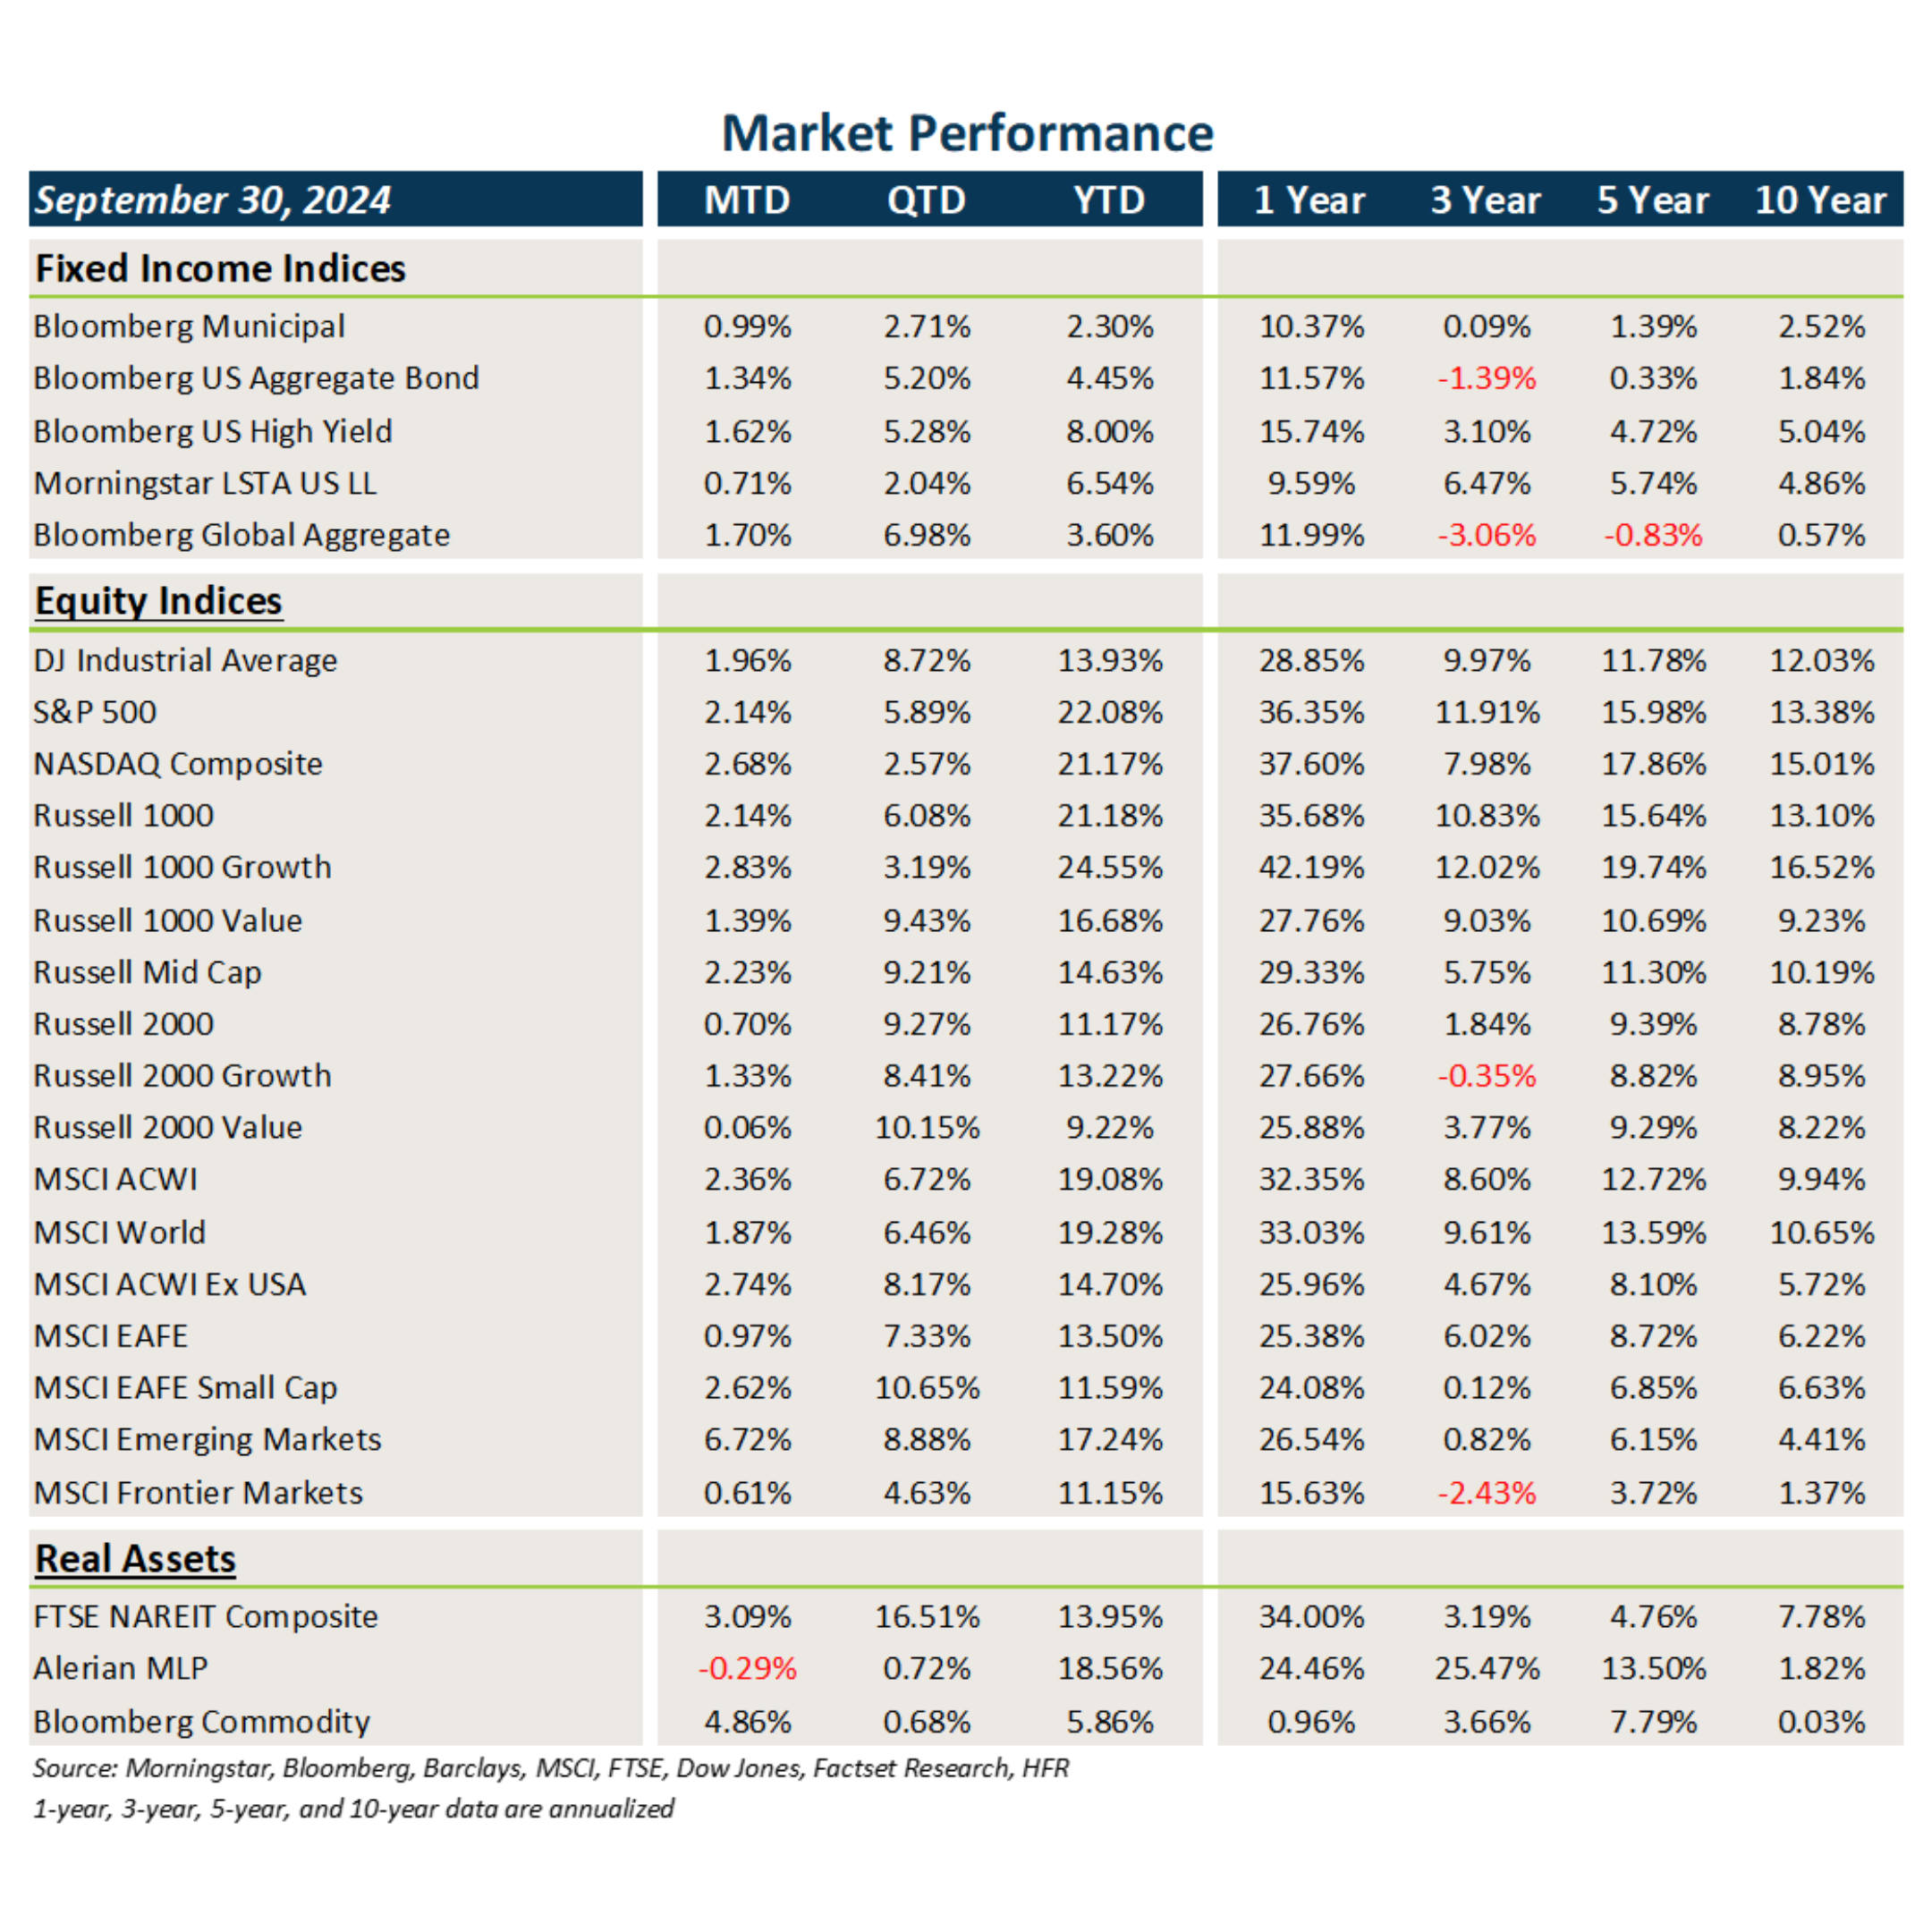
- Treasury and other sovereign debt yields continued to fall in September, leading to strong gains in core fixed income and municipal bonds.
- Credit spreads were largely flat last month, but price appreciation and higher carry led to solid total returns.
- Bonds outside the U.S. benefited from U.S. dollar weakness that provided an added boost to returns.
U.S. Equities
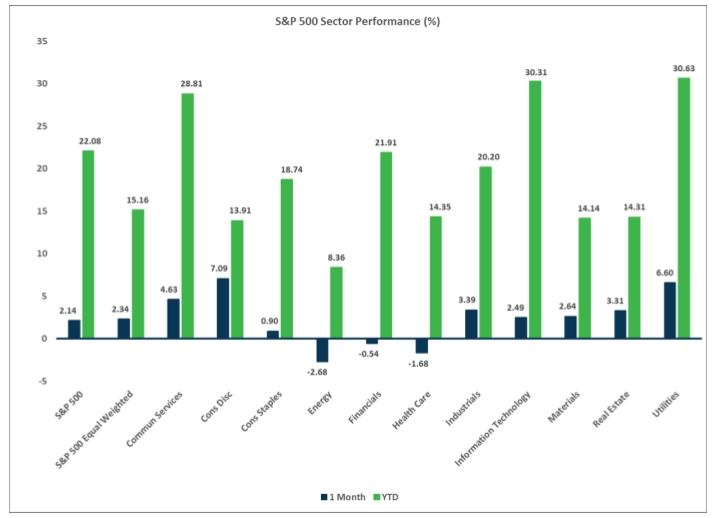
- U.S. equities posted solid gains in September, led by large caps and growth stocks.
- Growth stocks beat value stocks last month and large caps outperformed small caps.
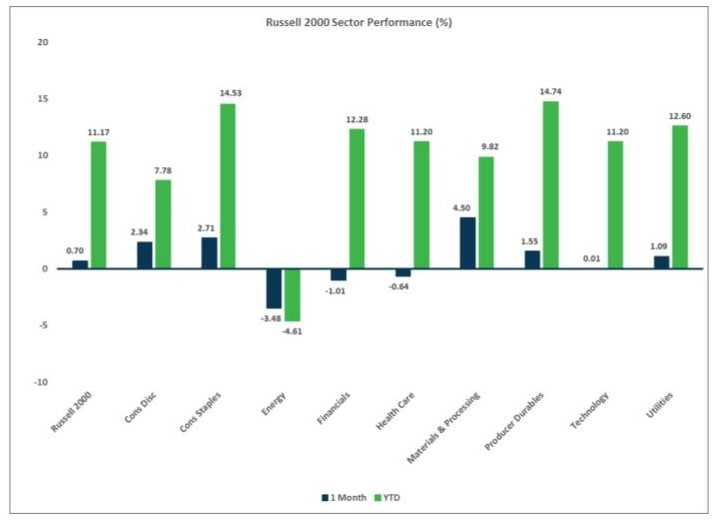
- Through the first nine months of 2024, the S&P 500 has gained 22.1% and the Russell 2000 has risen 11.2%.
Non-U.S. Equities
- Developed markets outside the U.S. exhibited weakness last month in local terms, but posted positive returns due to the weak U.S. dollar.
- Within EAFE markets, value stocks outperformed growth stocks and small caps handily beat large caps.
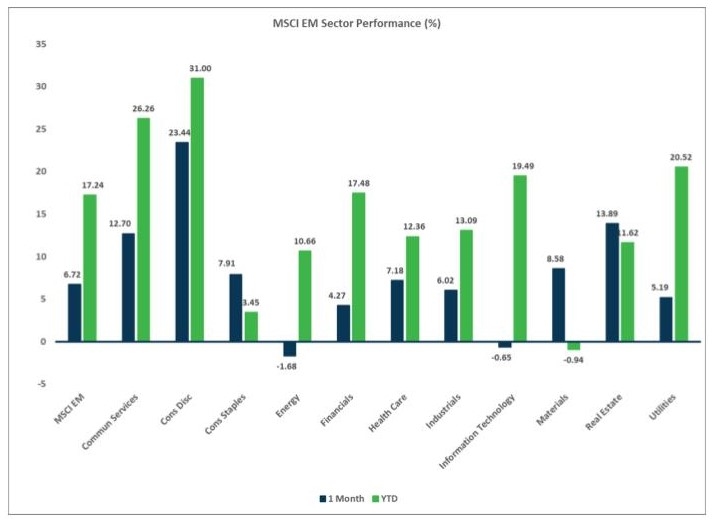
- EMs were the star performers in September led by the surge in China at the end of the month.
- The weak USD boosted EAFE returns by 131 bps and EM returns by 112 bps.
Sector Performance - S&P 500 (as of 09/30/24)
Sector Performance - Russell 2000 (as of 09/30/24)
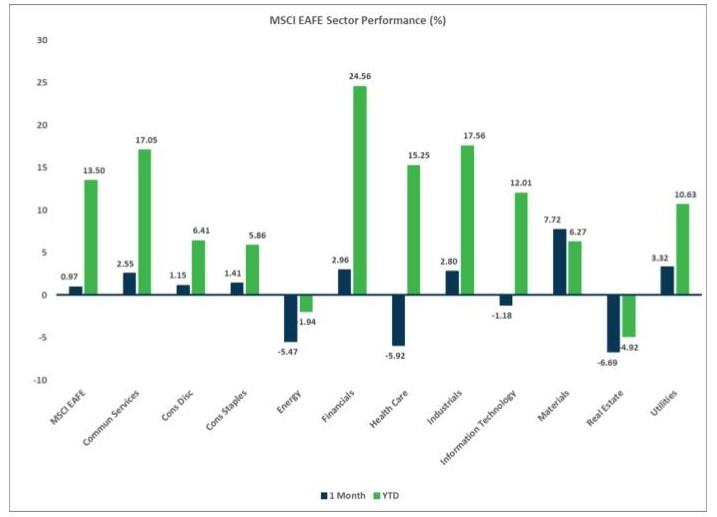
Sector Performance - MSCI EAFE (as of 09/30/24)
Sector Performance - MSCI EM (as of 09/30/24)