Market Flash Report January 2025

Economic Highlights
United States
- The U.S. economy expanded at a 2.3% annualized rate in Q4, below the 2.5% expectation and 3.1% clip in Q3. For the full year, GDP accelerated 2.8%, compared with 2.9% in 2023. Contributions to Q4 2024 GDP were mixed. Personal consumption, net exports and government spending added to GDP while investment detracted from the Q4 figure. Consumption added 2.82% points to GDP, supported by solid services consumption, which added 1.45%. Goods consumption, which added 1.37% of consumption’s 2.82%, was fueled by solid retail sales growth. Government spending added 0.42%, and net exports added 0.04%. On the downside, inventories fell in the latest quarter, deducting 1.03% from GDP.
- The December employment report showed stronger-than-expected job growth in the U.S. Employers added 256,000 new jobs to the economy, well ahead of the 155,000 estimate. The unemployment rate fell slightly from 4.2% to 4.1%. Average hourly earnings increased 0.3% M/M, which was in line with forecasts, but the 12-month gain of 3.9% was slightly below the outlook. Revisions from October and November were small compared to the 2024 trend. The broader U6 unemployment rate edged down to 7.5%.
- The Federal Reserve’s preferred inflation gauge, the Personal Consumption Expenditures (PCE) Index, accelerated a bit in December, with a headline reading of 2.6% Y/Y. December increased 0.2% over November’s report. Core PCE rose 0.2% M/M or 2.8% Y/Y. Food prices increased just 0.2% M/M, but energy jumped 2.7%. Durable goods prices, which include items such as aircraft, appliances and electronics, showed deflation, falling 0.4%. While December’s PCE report was in line with expectations, it showed that inflation remains above the Fed’s 2% target.
- Manufacturing in the U.S. moved back into expansion territory with the ISM Manufacturing Purchasing Manager’s Index (PMI) hitting 50.9 in January, versus December’s reading of 49.2. New orders, production and employment all strengthened back above the important 50 level. Despite the rebound, challenges remain with companies closely monitoring potential tariffs and supply chain concerns.
Non-U.S. Developed
- The eurozone reported flat economic growth in Q4, down from the 0.4% expansion in Q3 and the 0.1% estimate. Germany reported a contraction of 0.2% in Q4, France followed with a decline of 0.1% and GDP growth in Italy was flat. On the flip side, Spain’s GDP surged 0.8% and Portugal’s jumped 1.5%. The European Central Bank cut rates four times in 2024 to boost stagnant growth, and it began 2025 with another interest rate cut. The eurozone grew only 0.7% in 2024, well below the U.S. Inflation rose slightly in December to 2.5% Y/Y, largely driven by higher energy costs.
- Eurozone business activity returned to growth in January, led by a rebound in manufacturing. The Eurozone Flash Composite PMI increased from 49.6 in December to 50.2 in January. The service sector fell to a two-month low at 51.4, but manufacturing strengthened to an eight-month high of 46.1. There were signs of improvement in the eurozone’s largest economy, with business activity in Germany stabilizing. France remained in contraction and the rest of the eurozone outpaced the two largest countries.
- The Japanese government expects the economy to grow 1.2% in 2025, ahead of 2024’s pace. It expects 2% inflation and personal consumption growth of 1.3%. As always, we expect these figures to be fluid with the bias towards downgrades over upgrades.
Emerging Markets
- China’s economy expanded a better-than-expected 5.4% in Q4, perhaps signaling some benefits from recently announced stimulus measures. The growth surge in Q4 allowed the economy to meet its 5% growth target for 2024. Retail sales increased 3.7% Y/Y in December, industrial output rose 6.2% Y/Y and fixed asset investment rose less than expected as the drag from real estate steepened. Unemployment ticked higher in China, and a worrisome sign is the differences between domestic demand, industrial output and export-led growth. Widening trade gaps will likely only further stoke global trade tensions.
- China’s factory activity slowed in January as export orders evaporated ahead of additional U.S. tariffs. The Caixin Manufacturing PMI declined from 50.5 in December to 50.1 in January. Domestic orders improved last month although new export orders declined. The employment sub-index also slumped to the lowest level in nearly five years as businesses remained cautious amid economic uncertainty. China’s official Manufacturing PMI also declined into contraction territory last month (49.1).
- After hitting a nine-month high in December, China’s official Non-Manufacturing PMI dropped to 50.2 in January (from 52.2 in December). Domestic orders, export orders and employment all exhibited weakness.
- The annual inflation rate in China slipped to 0.1% in December, down from 0.2% in the previous month. The weakness highlights the mounting deflation risks in the country, despite massive stimulus measures unleased by the People’s Bank of China.
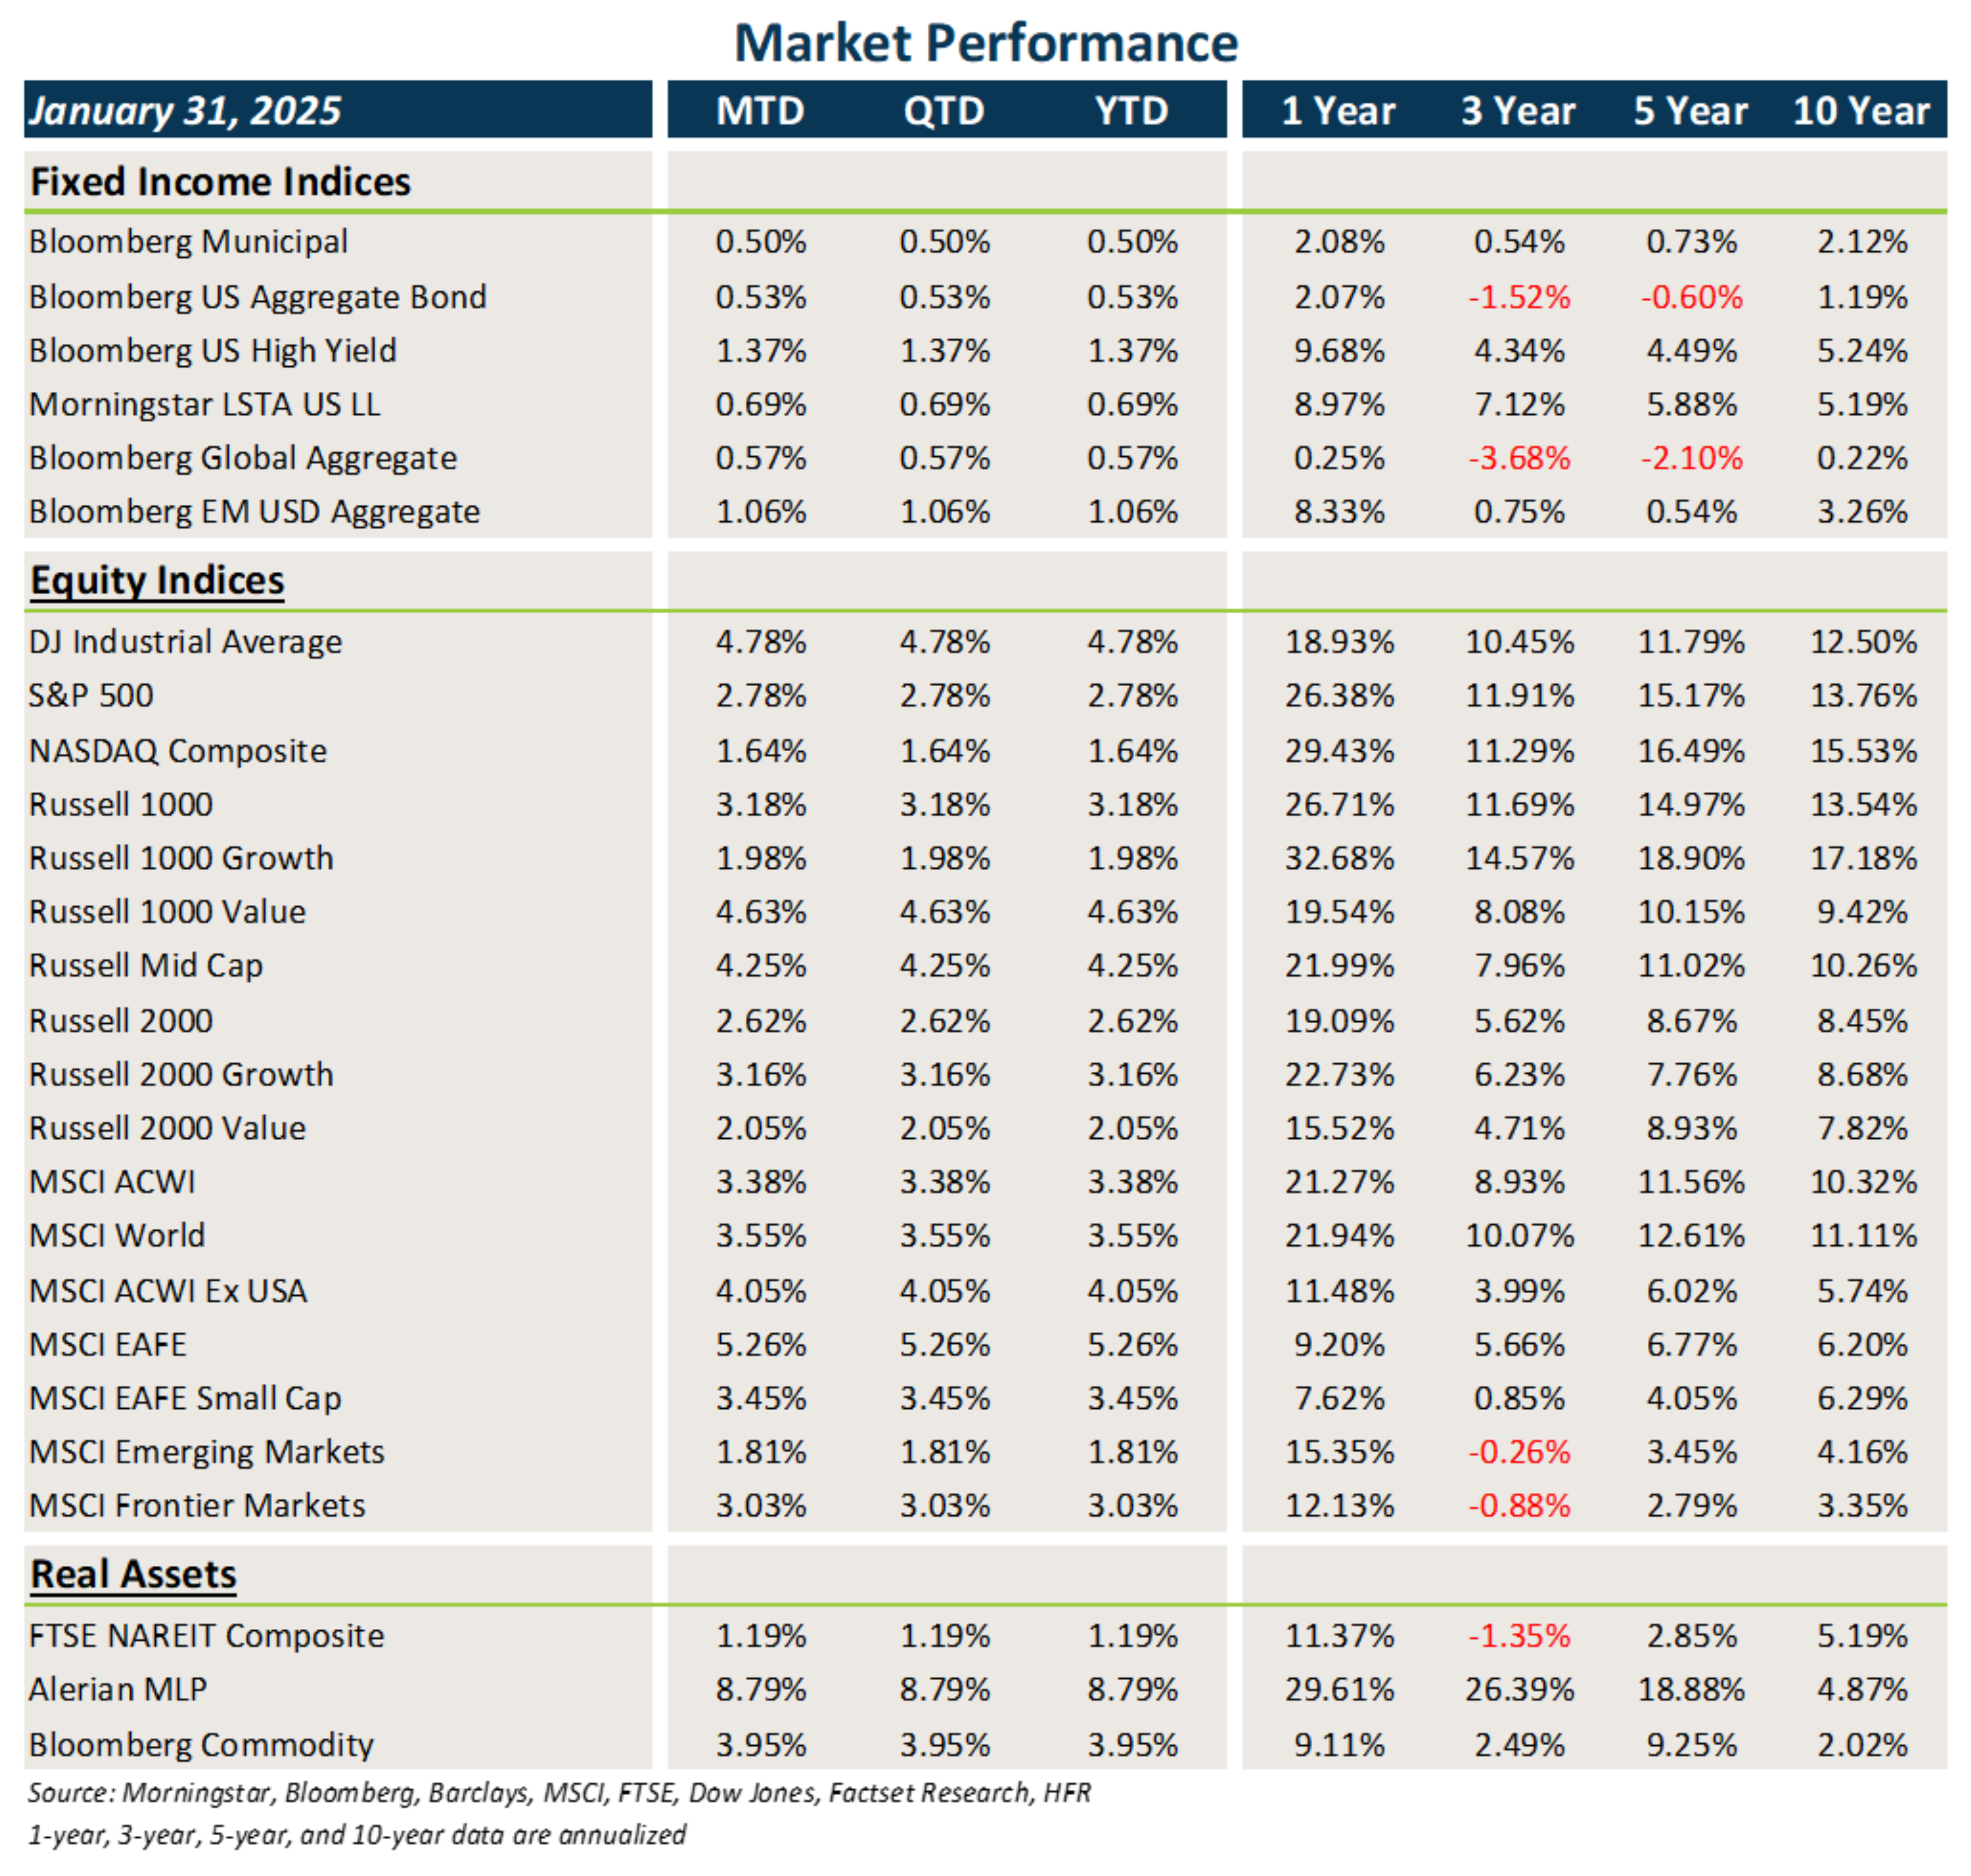
Fixed Income
- After moving higher to start the new year, Treasury and other sovereign debt yields finally leveled off and fell at the end of January.
- Core fixed income and municipal bonds posted modest gains last month while credit benefited from clipping higher coupons.
- Bonds outside the U.S. posted modest gains, largely fueled by a decline in rates and higher starting yields.
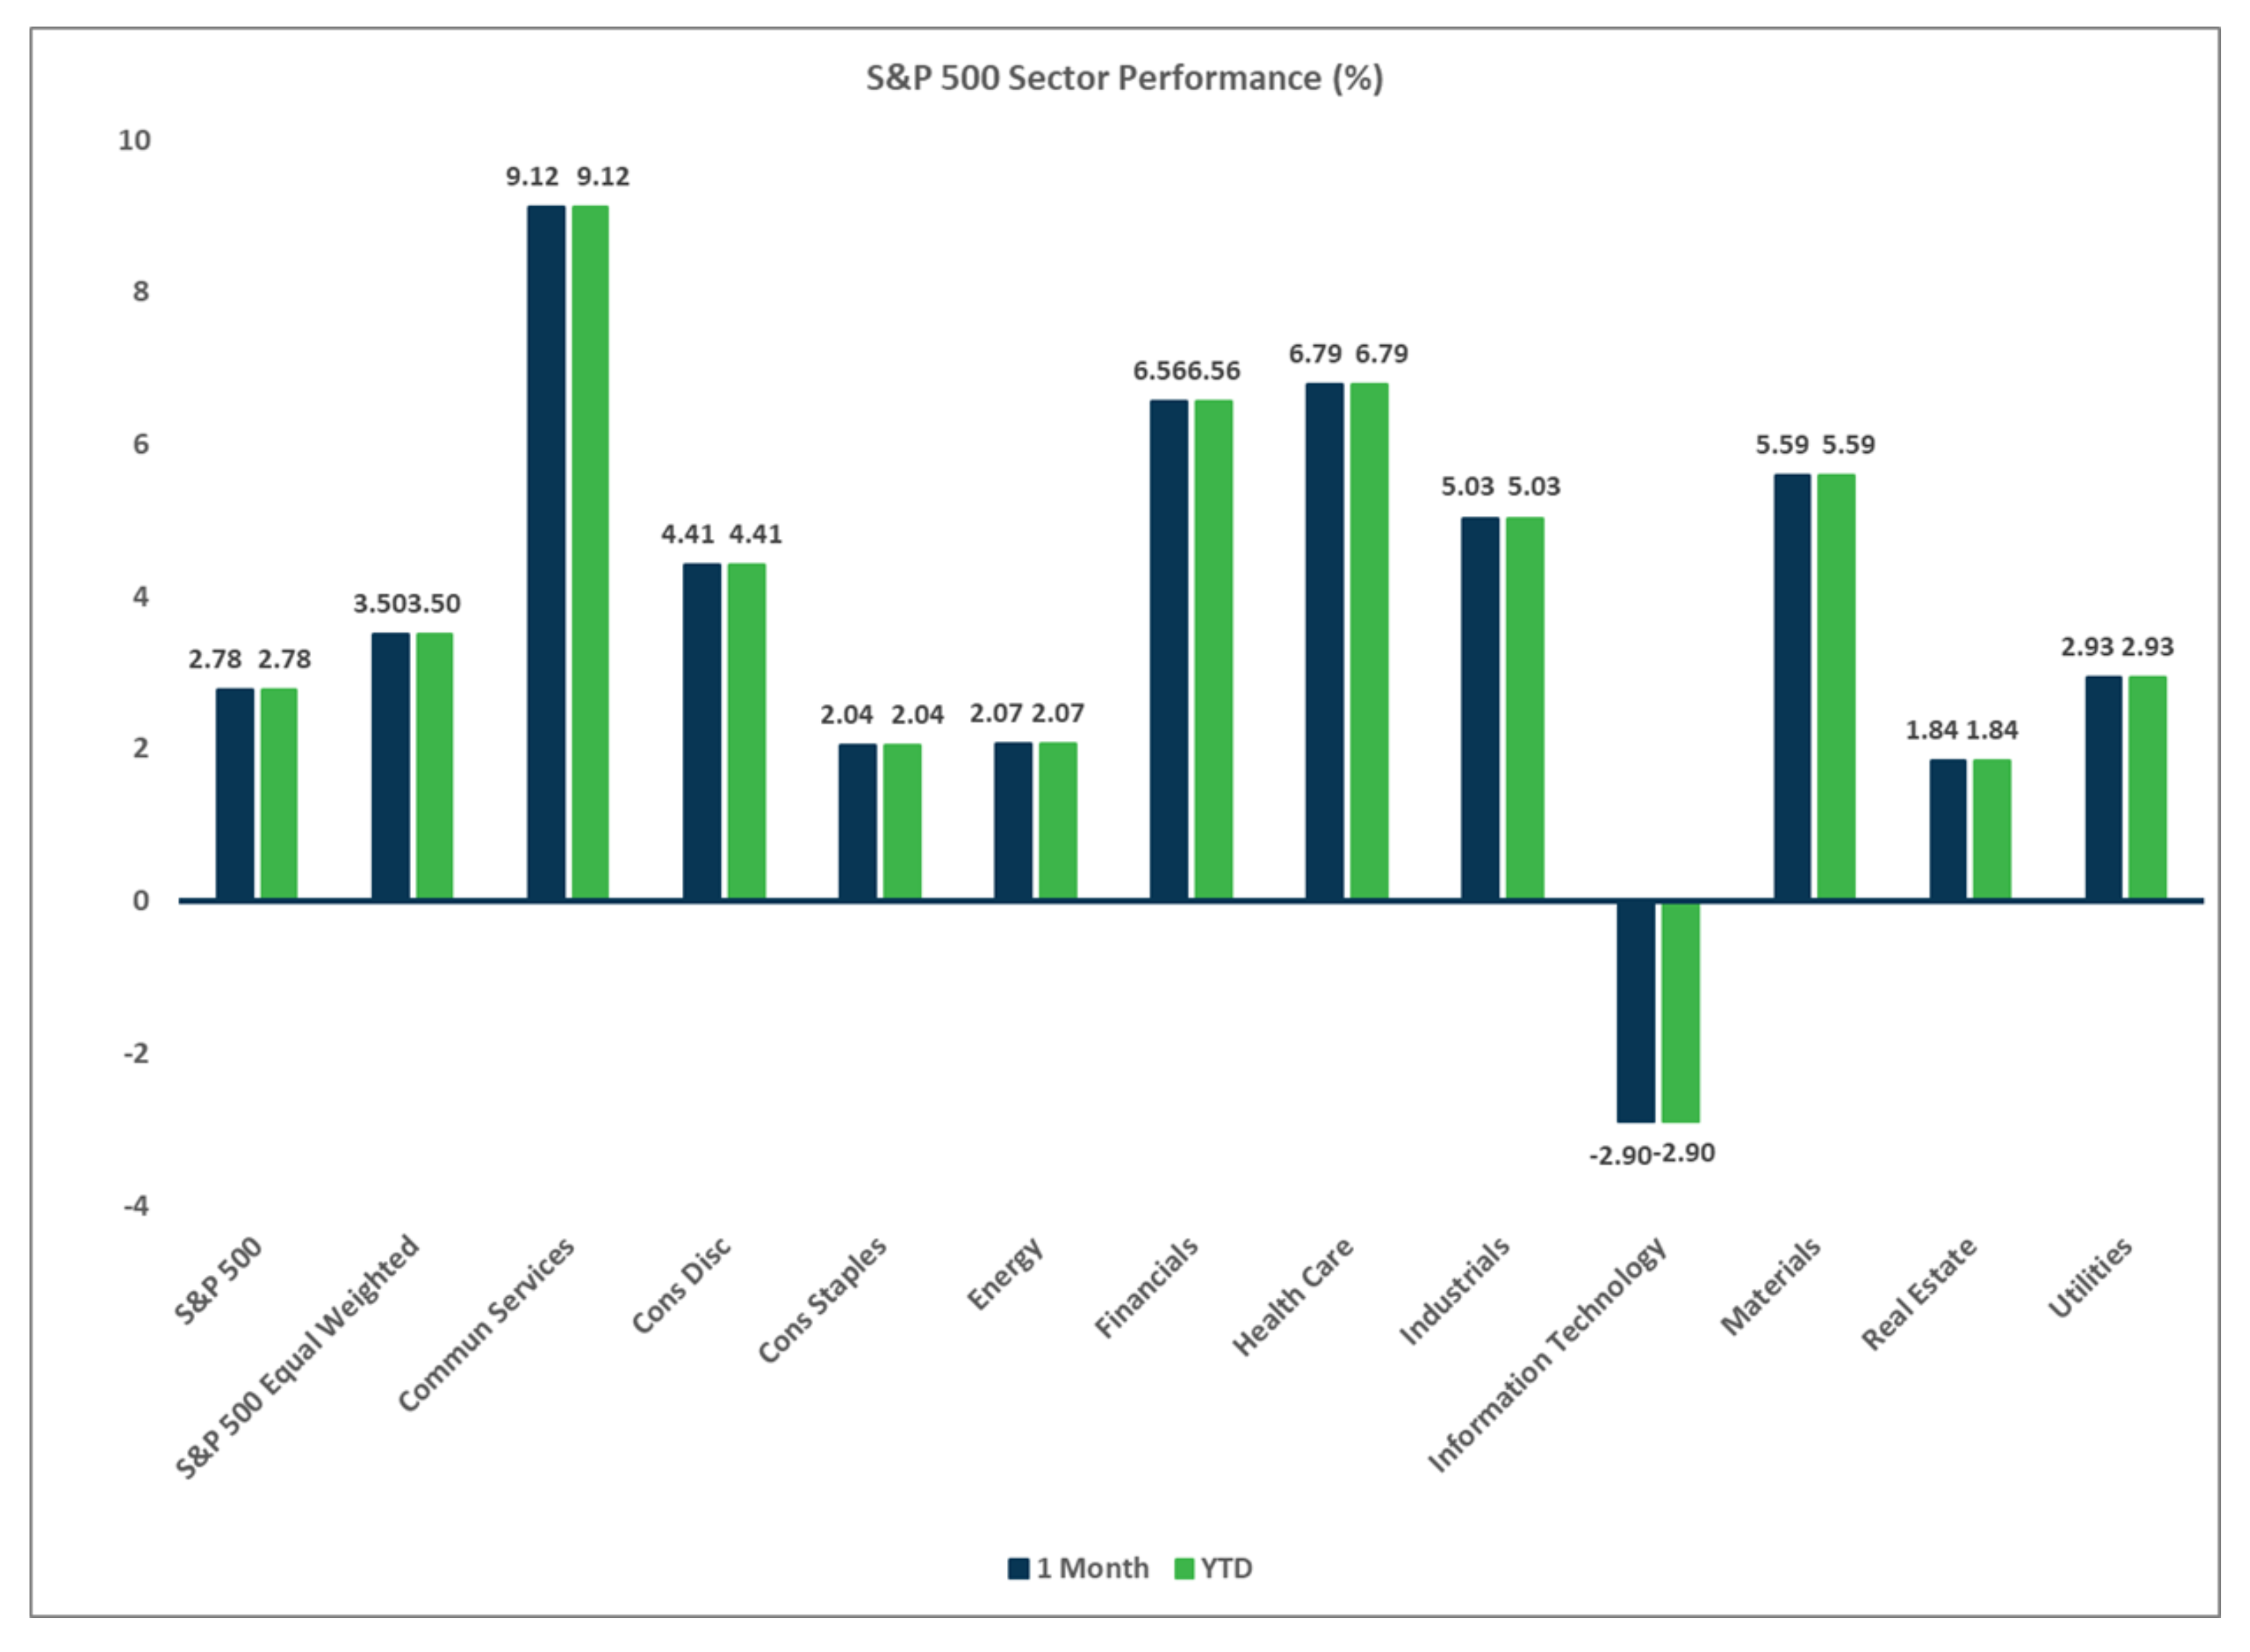
U.S. Equities
- U.S. equities posted solid gains in January, although volatility picked up in the final few weeks with weakness in large cap tech stocks, spooked by the DeepSeek AI news.
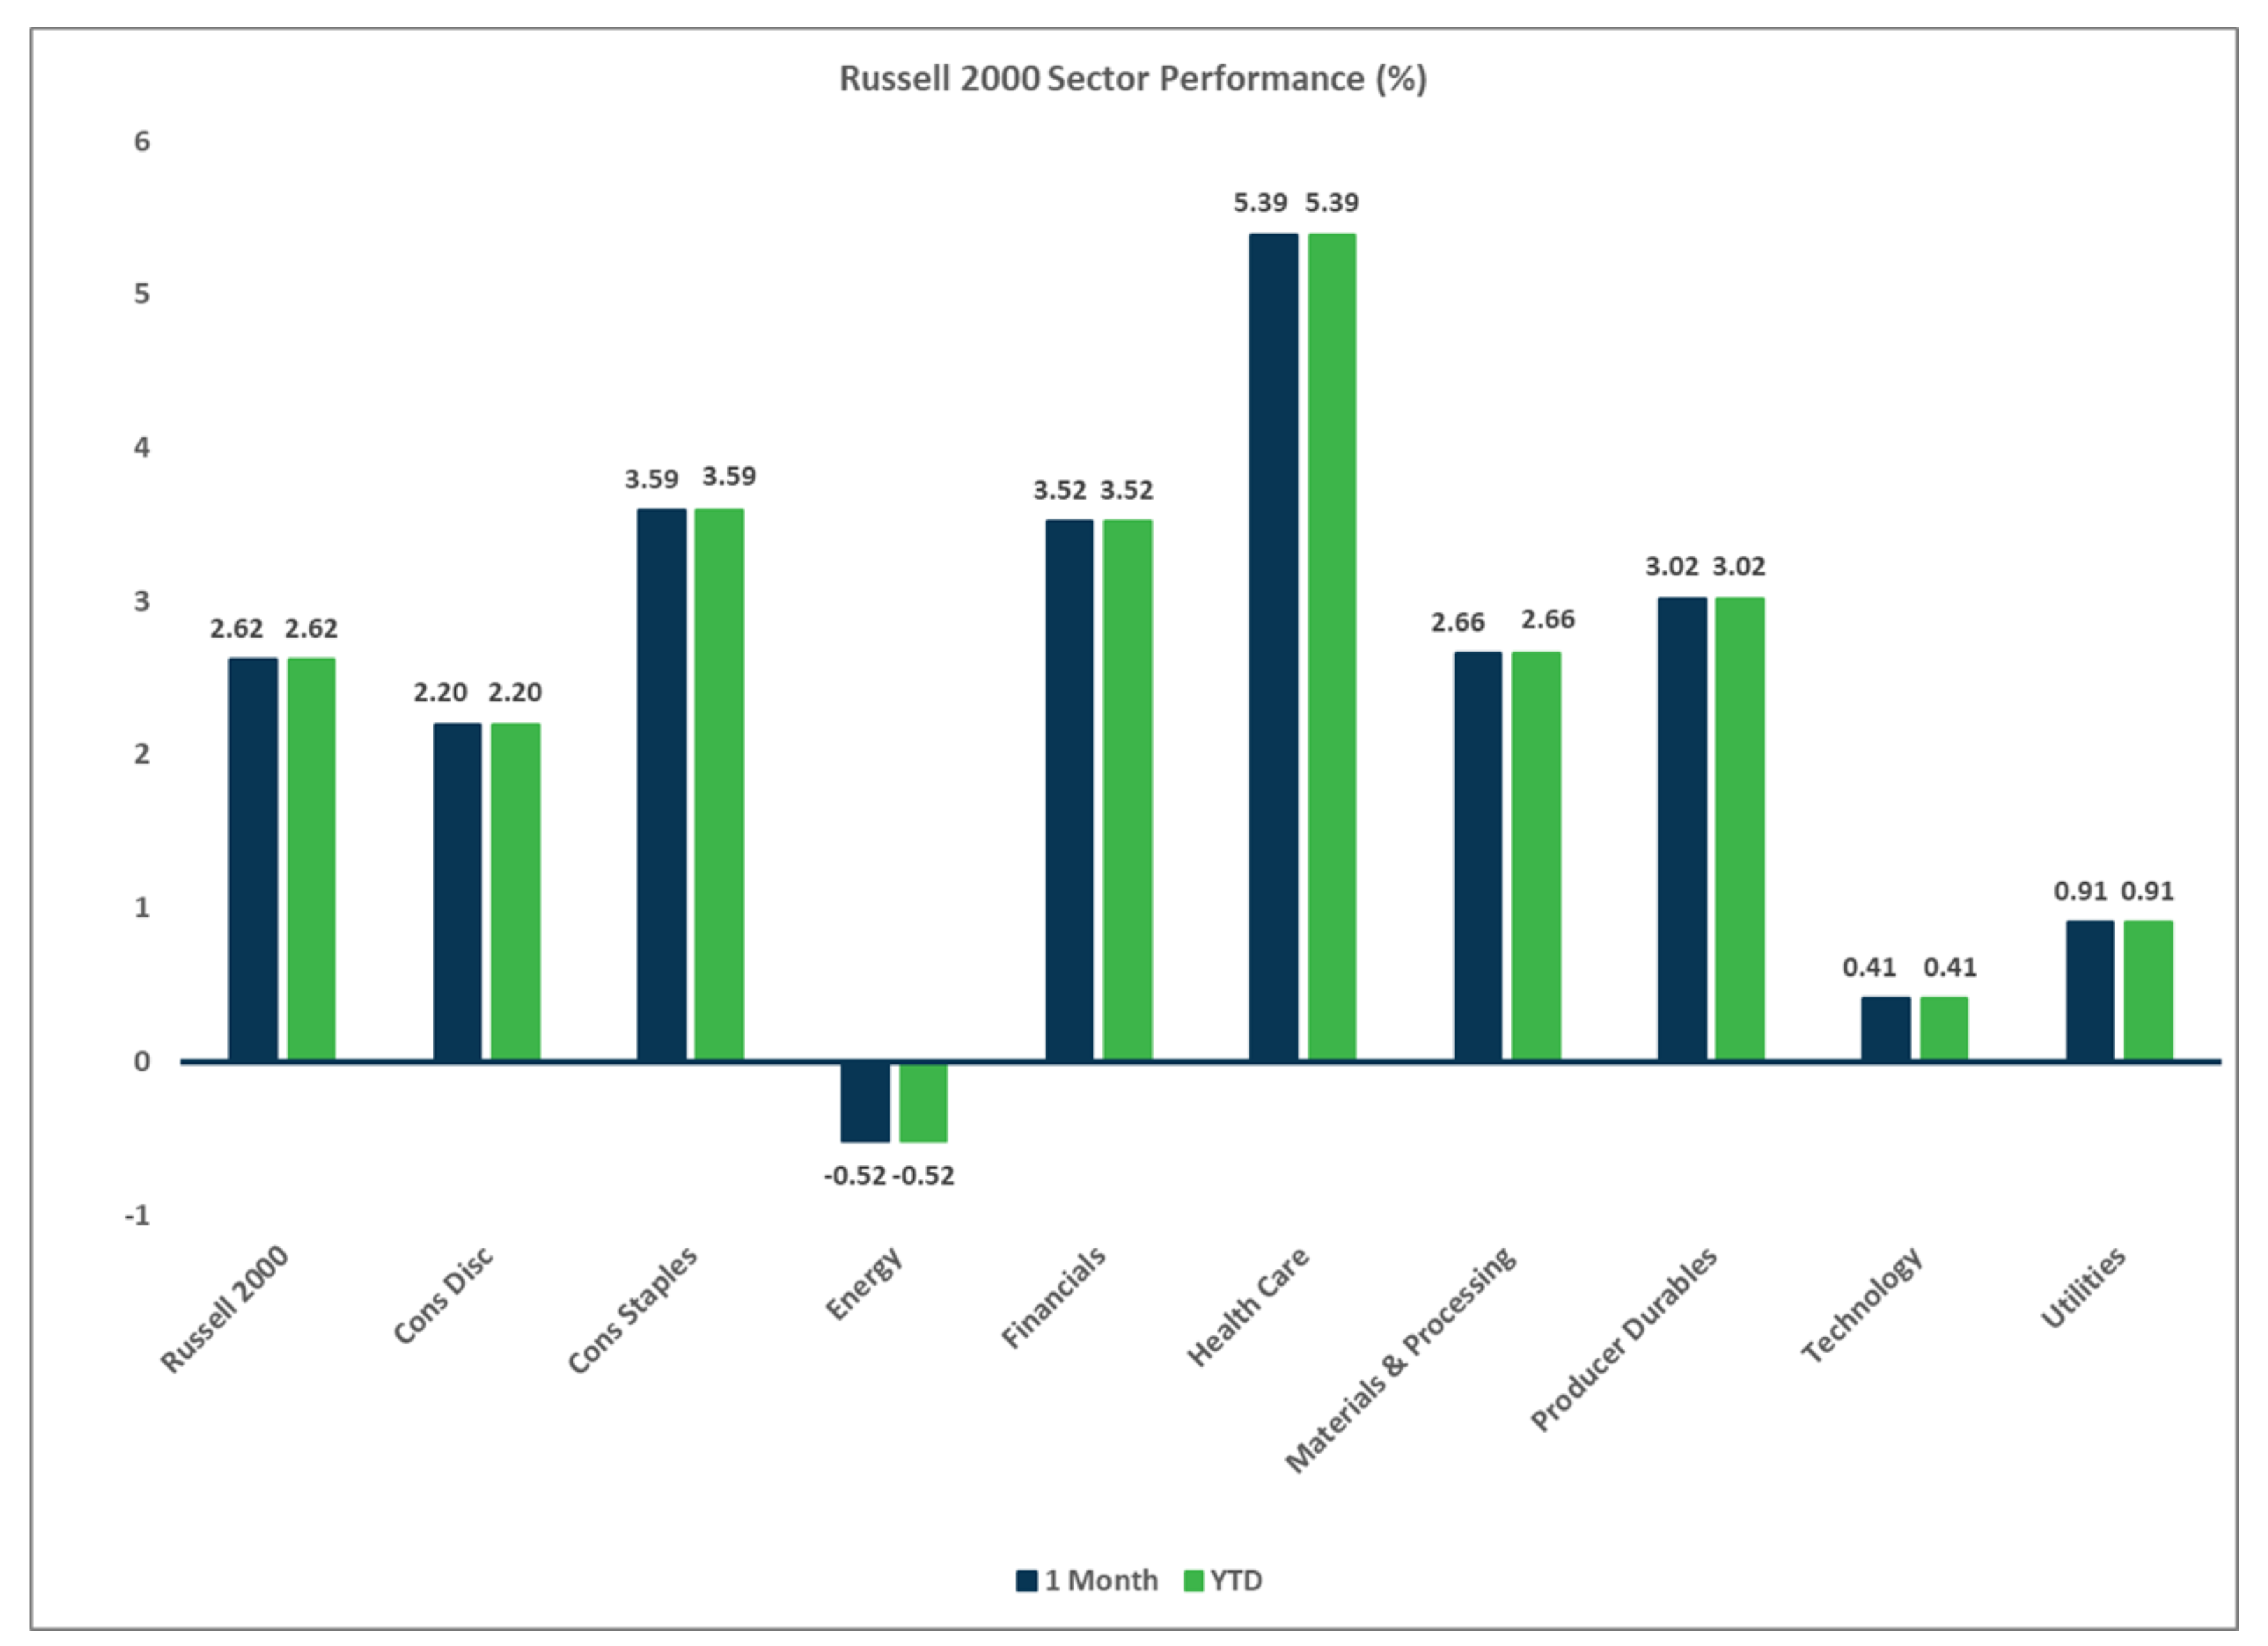
- Value outperformed growth last month and large caps outpaced small caps.
- The Nasdaq was particularly weak as tech is a much larger concentration.
Non-U.S. Equities
- Developed markets outside the U.S. exhibited relative strength, the U.S., as the tech sector, is less of a market driver.
- Large caps beat small caps and unlike the U.S., growth slightly beat value.
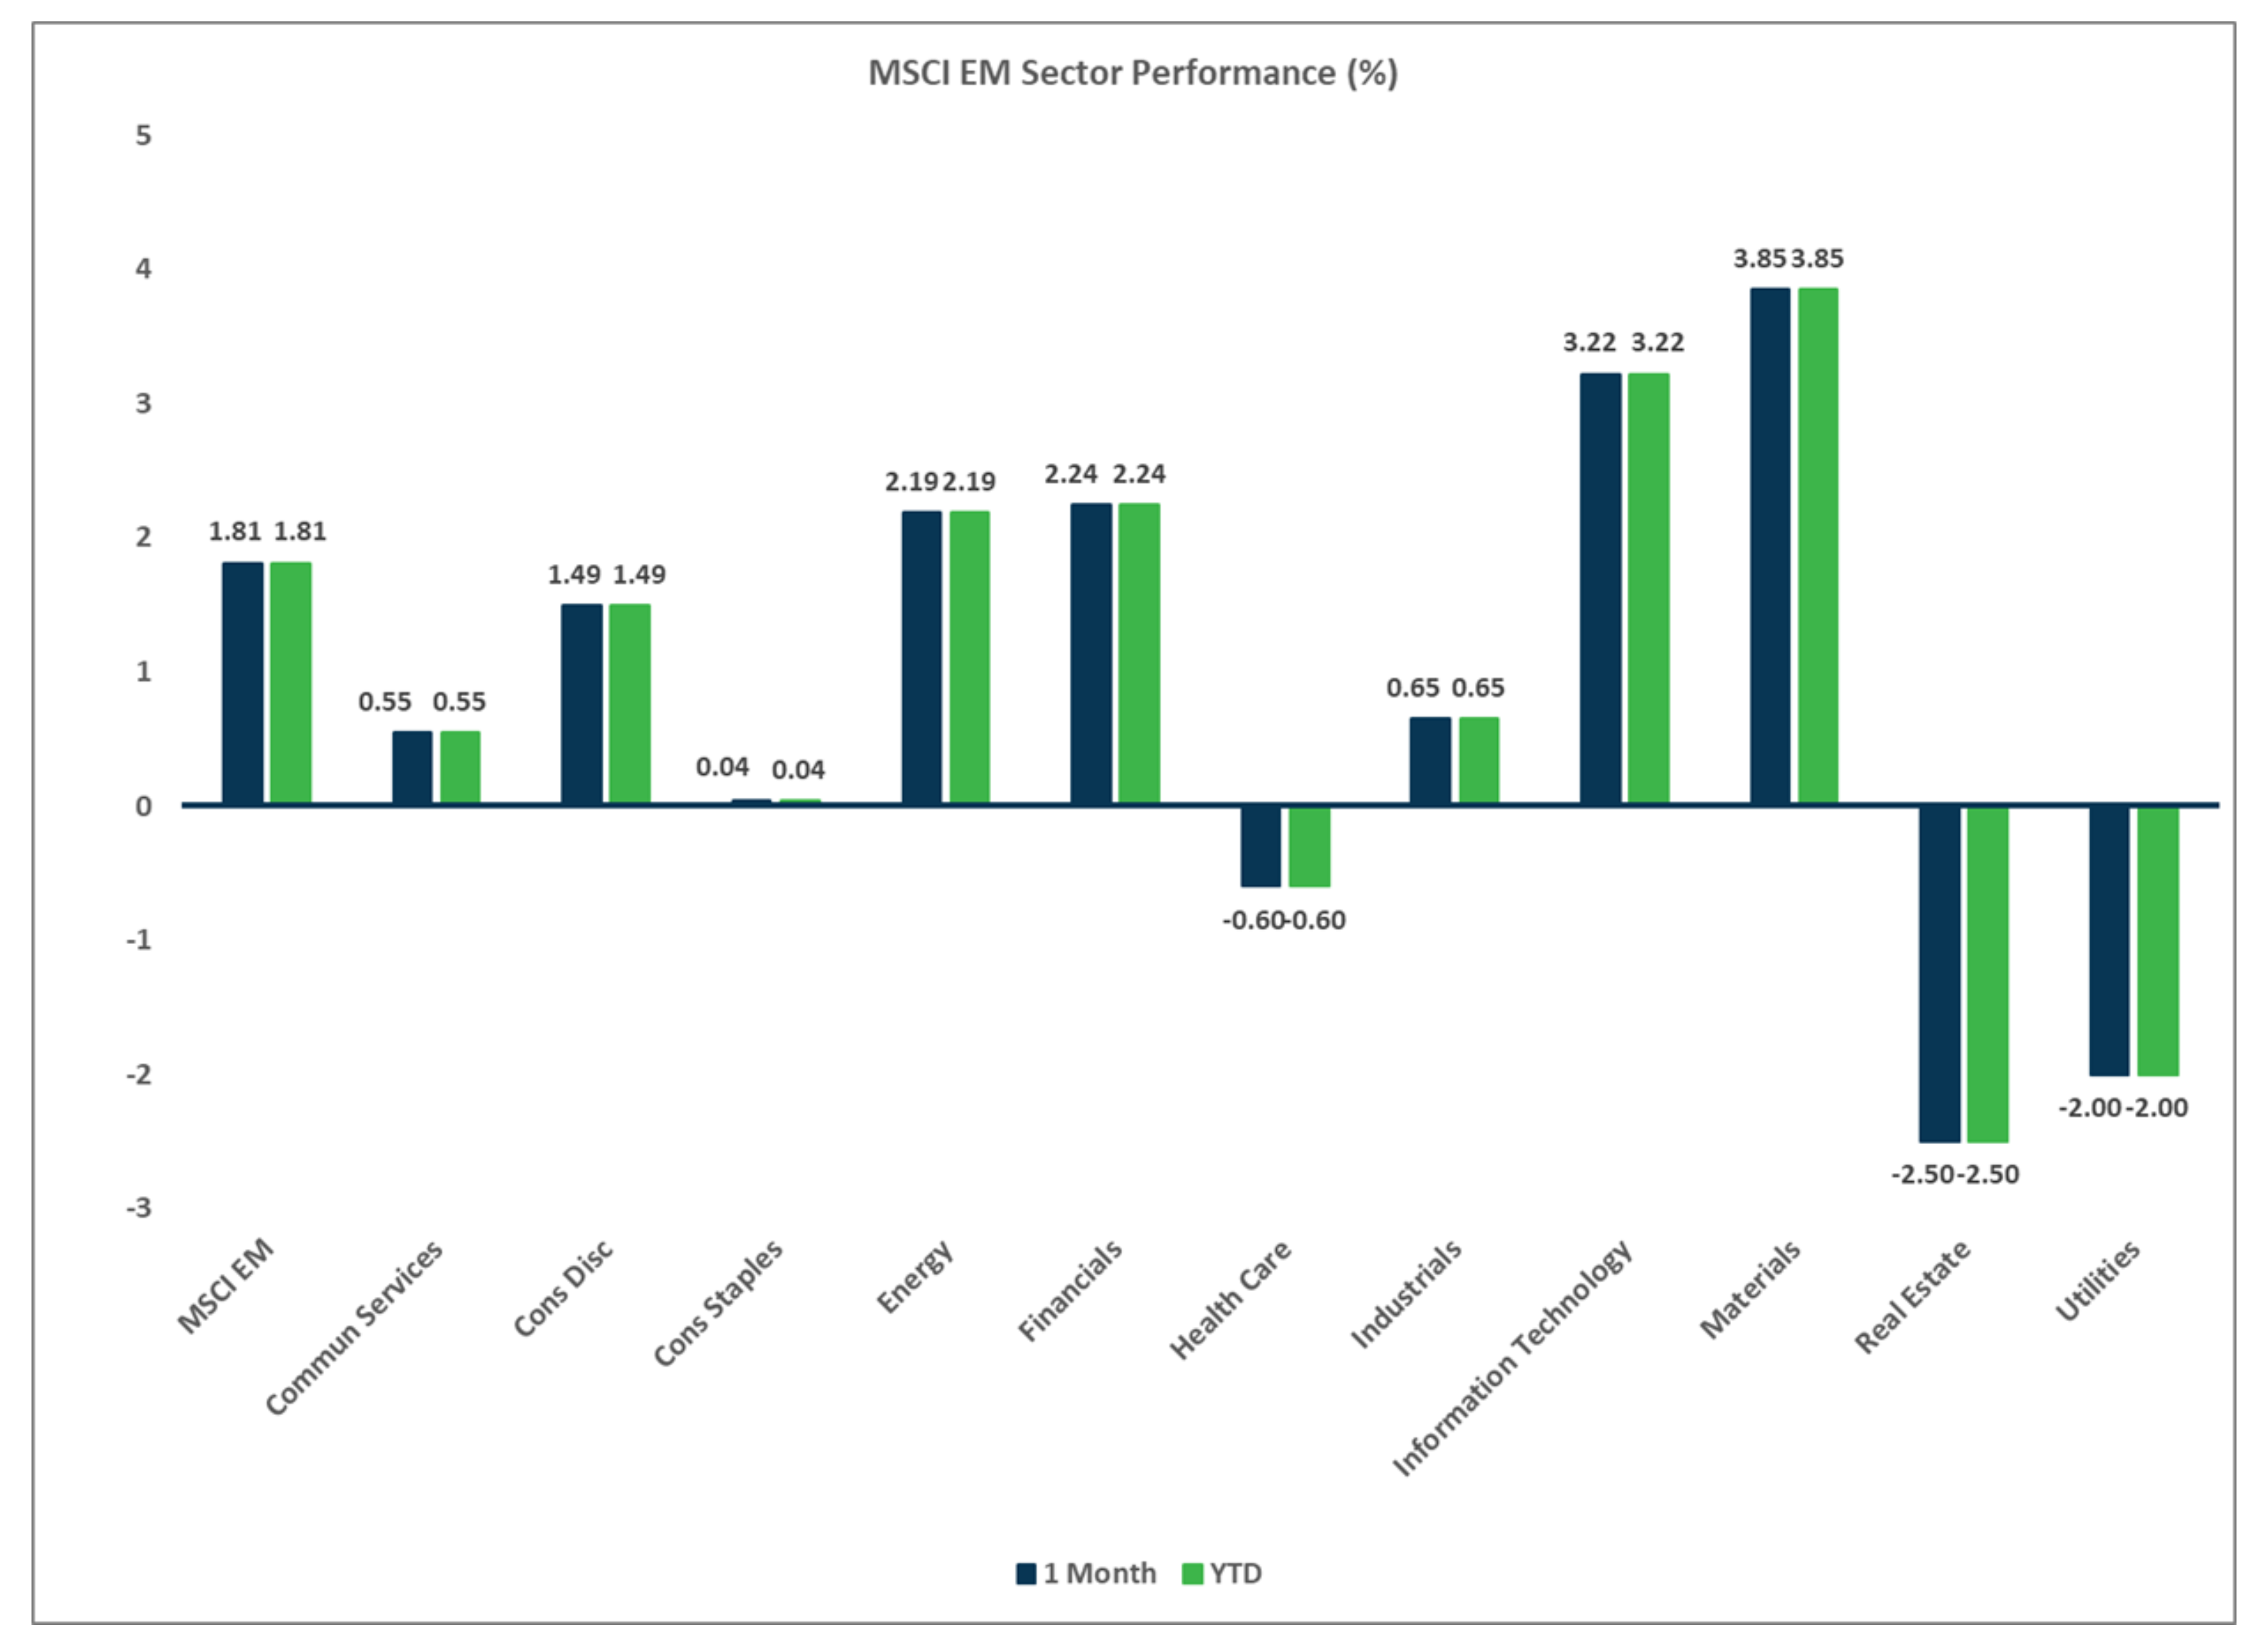
- Emerging markets (EM) were positive but lagged developed markets due to weakness in China.
- USD weakness was a modest tailwind last month with 43 bps of contribution to EAFE returns and 19 bps for EM returns.
Sector Performance - S&P 500 (as of 01/31/25)
Sector Performance - Russell 2000 (as of 01/31/25)
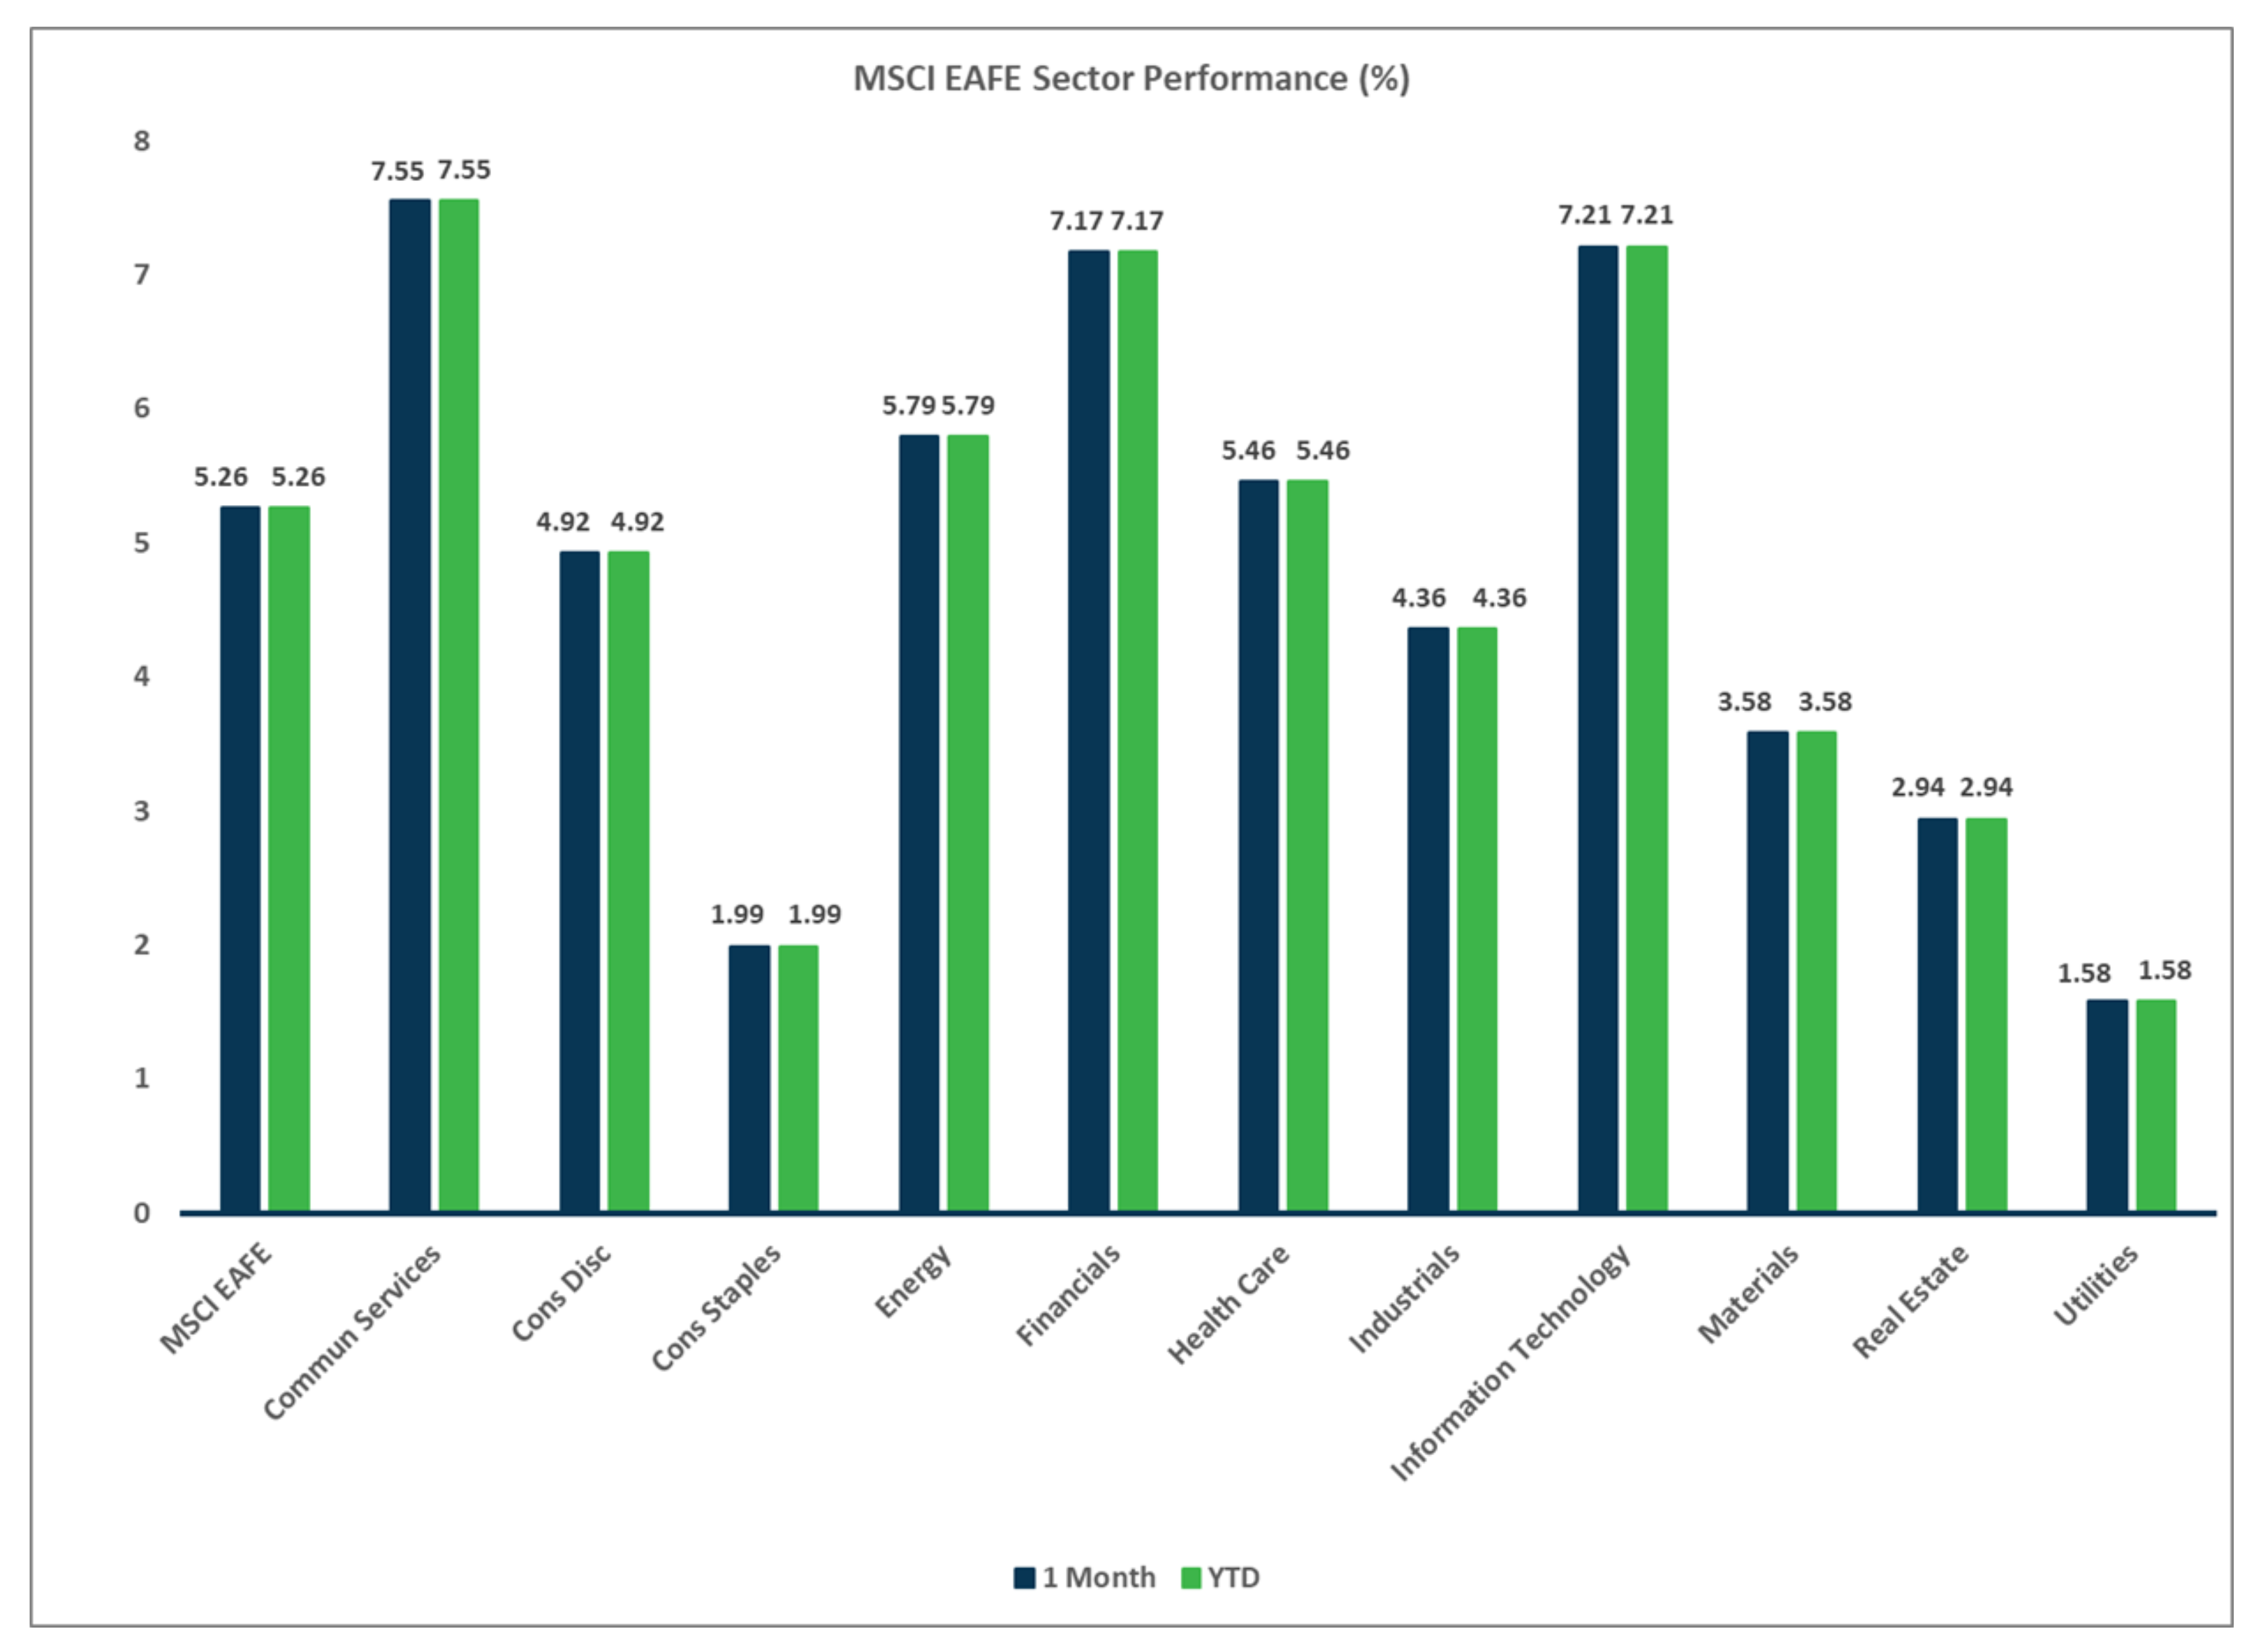
Sector Performance - MSCI EAFE (as of 01/31/25)
Sector Performance - MSCI EM (as of 01/31/25)