Market Flash Report | March 2025

Economic Highlights
United States
- U.S. employers added 151,000 new jobs to the economy in February, below the 170,000 estimate. Revisions from the prior two months were just about flat. The unemployment rate edged higher to 4.1% and average hourly earnings growth came in at an annualized rate of 4%. The federal government shed 10,000 jobs last month, but most of the Department of Government Efficiency (DOGE) cuts were announced after the reporting period and should be reflected in March. A broader measure of unemployment that includes discouraged workers and those holding part-time jobs for economic reasons jumped 0.5% to 8%, the highest level since October 2021.
- The Federal Reserve’s key inflation measure rose more than expected in February, while consumer spending also posted a smaller-than-projected increase. Headline Personal Consumption Expenditures (PCE) rose 0.3% M/M, or 2.5% Y/Y, and Core PCE jumped 0.4% M/M, or 2.8% Y/Y. Consumer spending increased 0.4% in February, slightly below the 0.5% estimate. Consumer Price Index (CPI) inflation remains “hotter” at 2.8% for headline and 3.1% for core.
- Retail sales rose 0.2% in February after a downwardly revised 1.2% decline in January, the biggest drop since November 2022. The report showed a sharp decline in receipts at restaurants and bars, suggesting a softening in discretionary spending. Core retail sales did increase 1%, an important reading since it correlates most closely with the consumer spending component of GDP.
- Durable goods orders rose 0.9% in February after surging 3.3% in January. Orders for core capital goods fell 0.3% and shipments of core capital goods rebounded 0.9%.
- Manufacturing in the U.S. fell back into contraction territory based on the March ISM Manufacturing PMI reading. The headline figure was 49.0 for March, down from 50.3 in February. New orders, production and employment all weakened, but prices spiked higher, perhaps suggesting some pricing pressures being felt ahead of tariffs.
Non U.S. Developed
- Business activity in the eurozone grew for the third consecutive month in March and rose to a 7-month high at 50.4 (up from 50.2 in February). Manufacturing production increased for the first time in two years, joining services in growth territory. Although the Manufacturing PMI increased to a 26-month high, the 48.7 level remained below 50, which separates contraction from expansion. Perhaps more of a concern was the decline in activity across the service sector, which fell to a 4-month low at 50.4. While still sluggish today, the outlook for Germany and the rest of the eurozone looks a bit brighter with the potential for higher defense spending on the horizon.
- Inflation in the eurozone fell slightly in March. CPI fell from 2.3% in February to 2.2% in March, and core CPI declined from 2.6% to 2.4%. The unemployment rate fell to 6.1% in February.
- Japan revised its Q4 annual GDP growth figure down from 2.8% to 2.2%. It was the third straight quarter of expansion, and the government maintains that the economy is moderately recovering. On a quarter-to-quarter basis, seasonally adjusted real GDP grew 0.6%, revised from 0.7%. Private demand shrank 0.3%, worse than the 0.1% given earlier. Exports grew 1.0%, instead of the earlier 1.1%. 2024 growth remained unchanged at a meager 0.1%.
Emerging Markets
- China continues to show signs of life with March PMI data coming in ahead of expectations. The official Manufacturing PMI was 50.5 in March, the highest reading since March 2024. Production and new orders increased, perhaps signaling improvement in supply and demand.
- China’s official non-manufacturing PMI hit a 3-month high at 50.8 in March. While services showed increased activity, the employment sub-component weakened.
- The step-up in stimulus measures by the People’s Bank of China (PBOC) have boosted infrastructure spending and maintained exports at very resilient levels. Economists expect some economic weakness in Q1, largely due to soft service sector and consumer spending trends. The Chinese government is targeting GDP growth of around 5% in 2025, although the tariff impact remains uncertain.
- Consumer prices in China have plunged to their lowest level in more than a year, highlighting persistent deflationary pressures in the world’s second-largest economy. CPI fell 0.7% Y/Y in February, well below expectations and the first contraction since January 2024. Core CPI also contracted for the first time since January 2021, and the Producer Price Index (PPI) dropped 2.2%. China’s economy continues to be weighed down by weak consumer spending, uncertain employment outlook and a prolonged property sector downturn.
- India’s economy just surpassed $4T in output for the first time due to strong growth over the past decade. India is now the fifth-largest economy on Earth and should surpass Japan ($4.4T) for the fourth spot. India’s economy has growth from $2T in 2014 and is expected to maintain growth rates of 6-6.5% over the coming years.
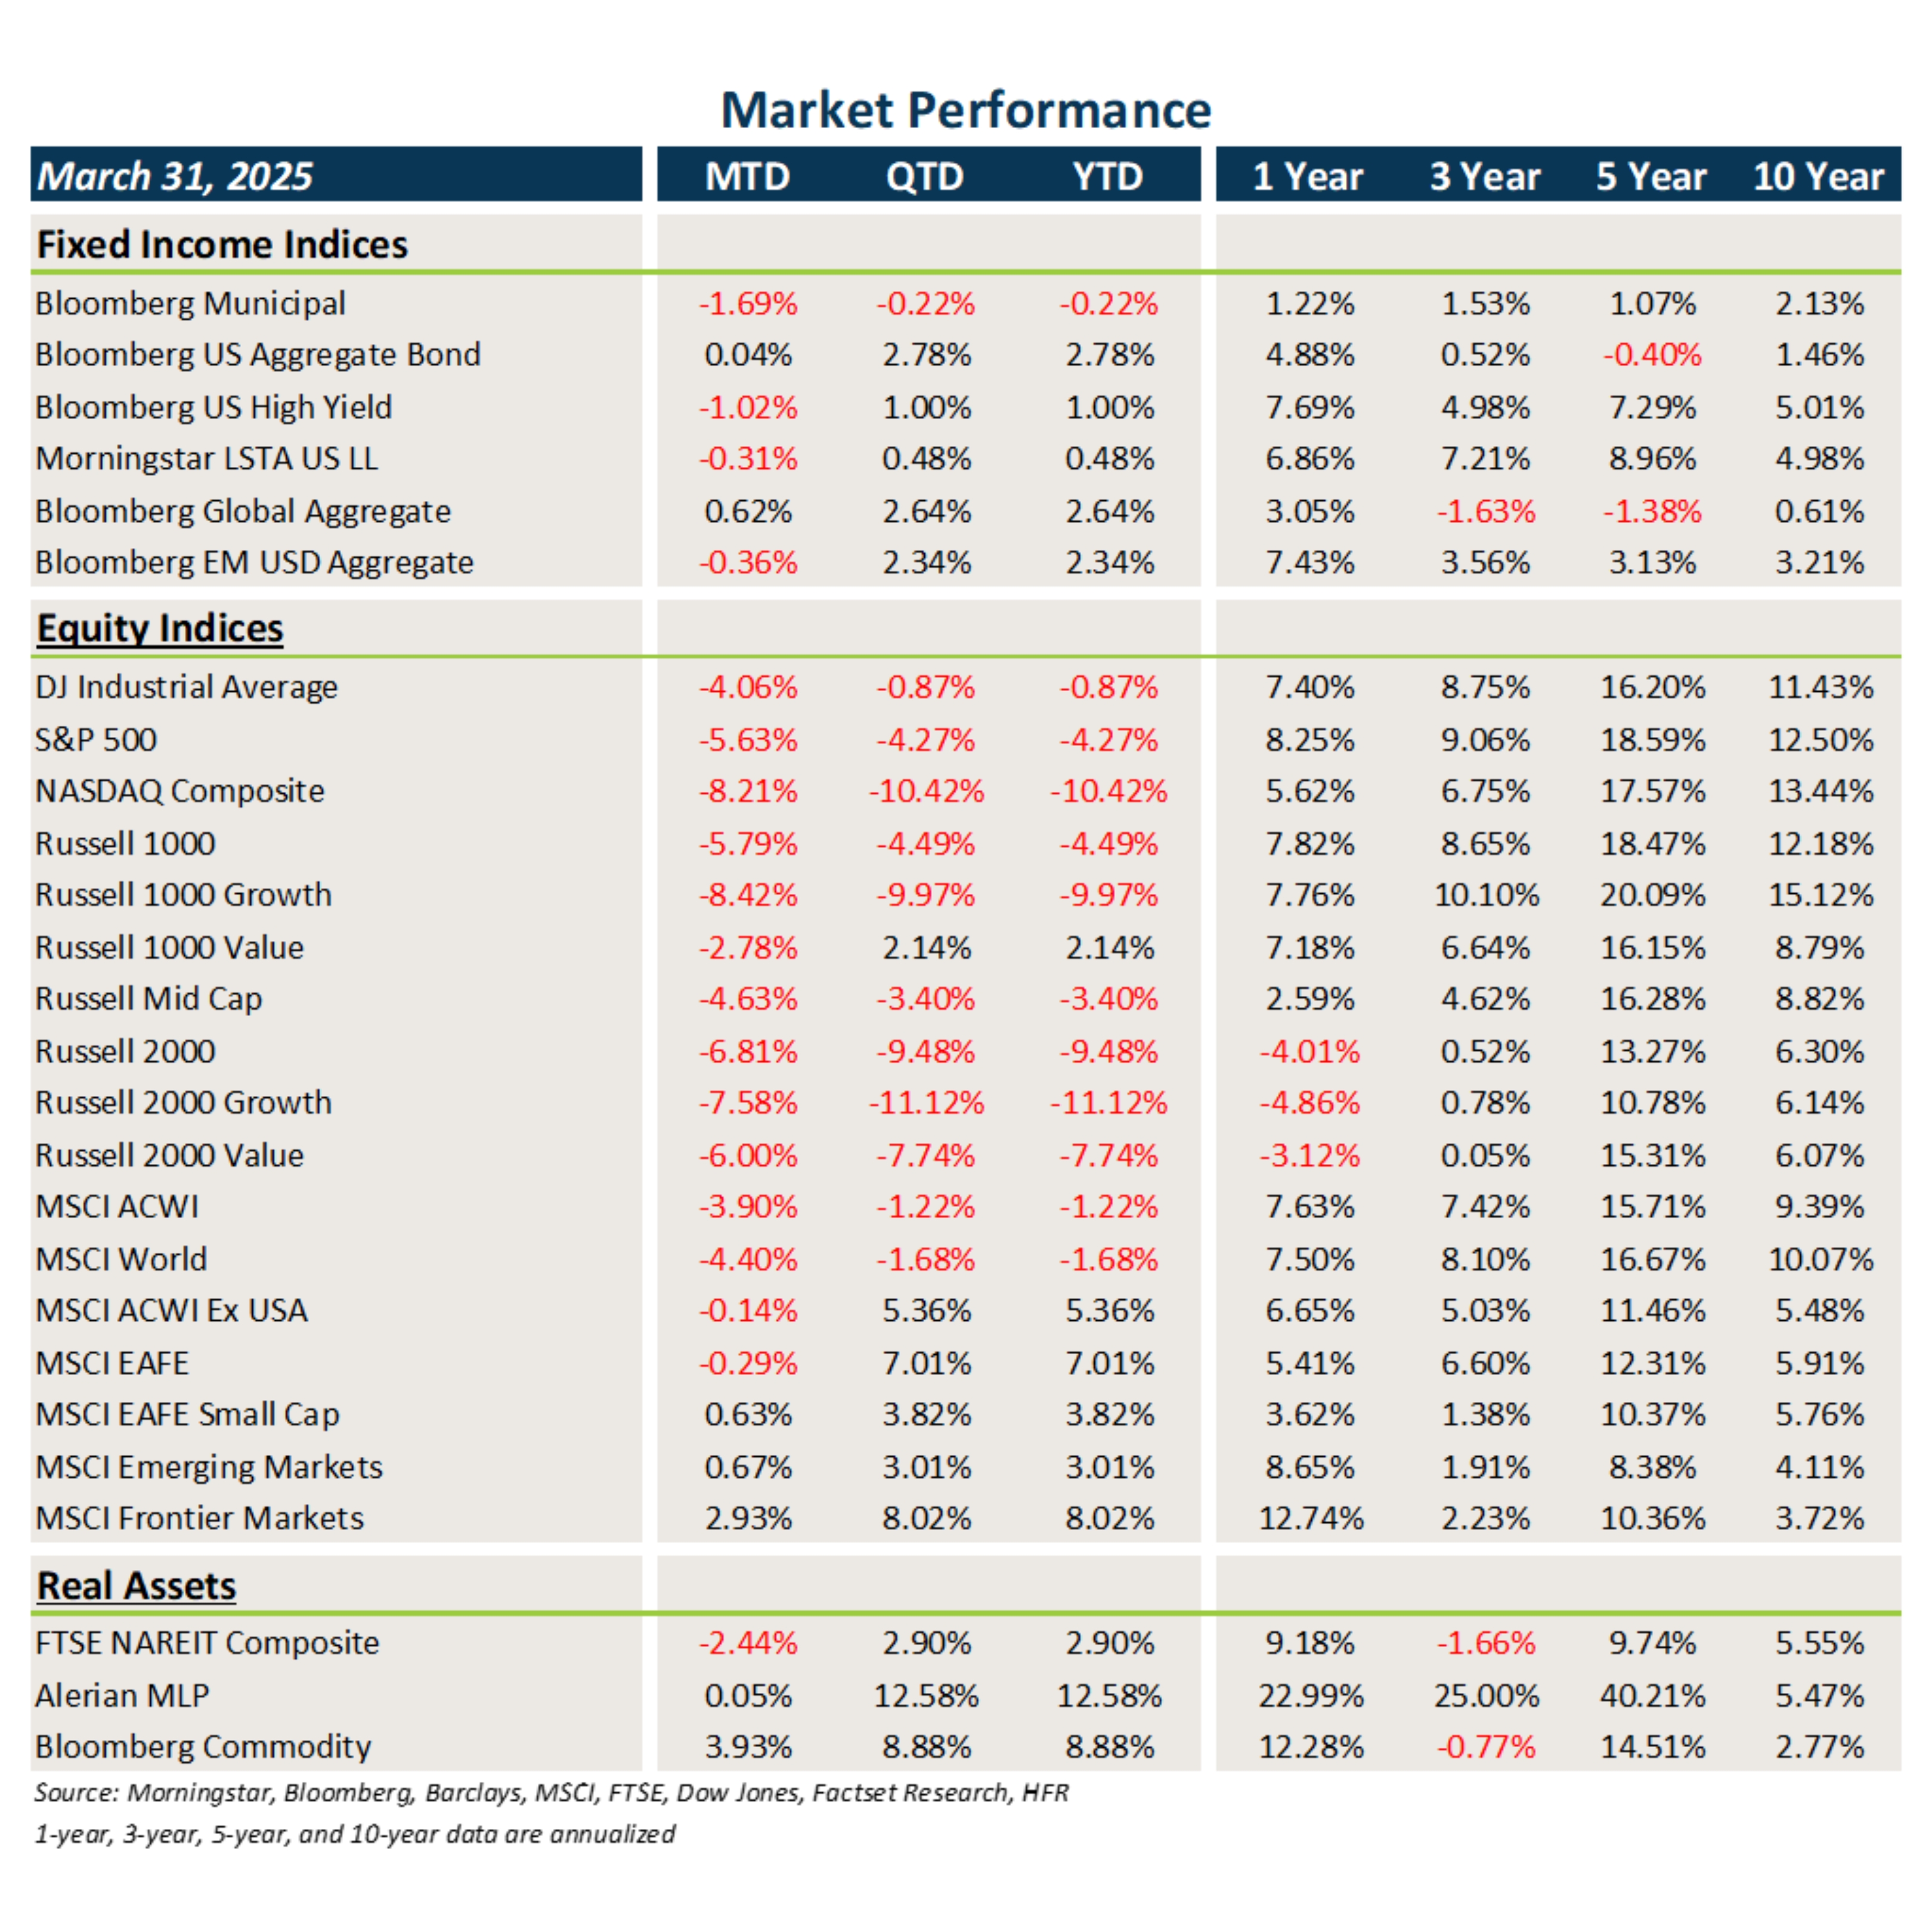
Fixed Income
- Treasury and other sovereign debt yields were fairly range-bound in March, leading to flattish returns in core fixed income. Munis suffered from a poor technical environment.
- Credit spreads widened in March, causing weakness in high yield, loans and Earnest Money Deposit (EMD).
- Bonds outside the U.S. benefited from the weaker USD.
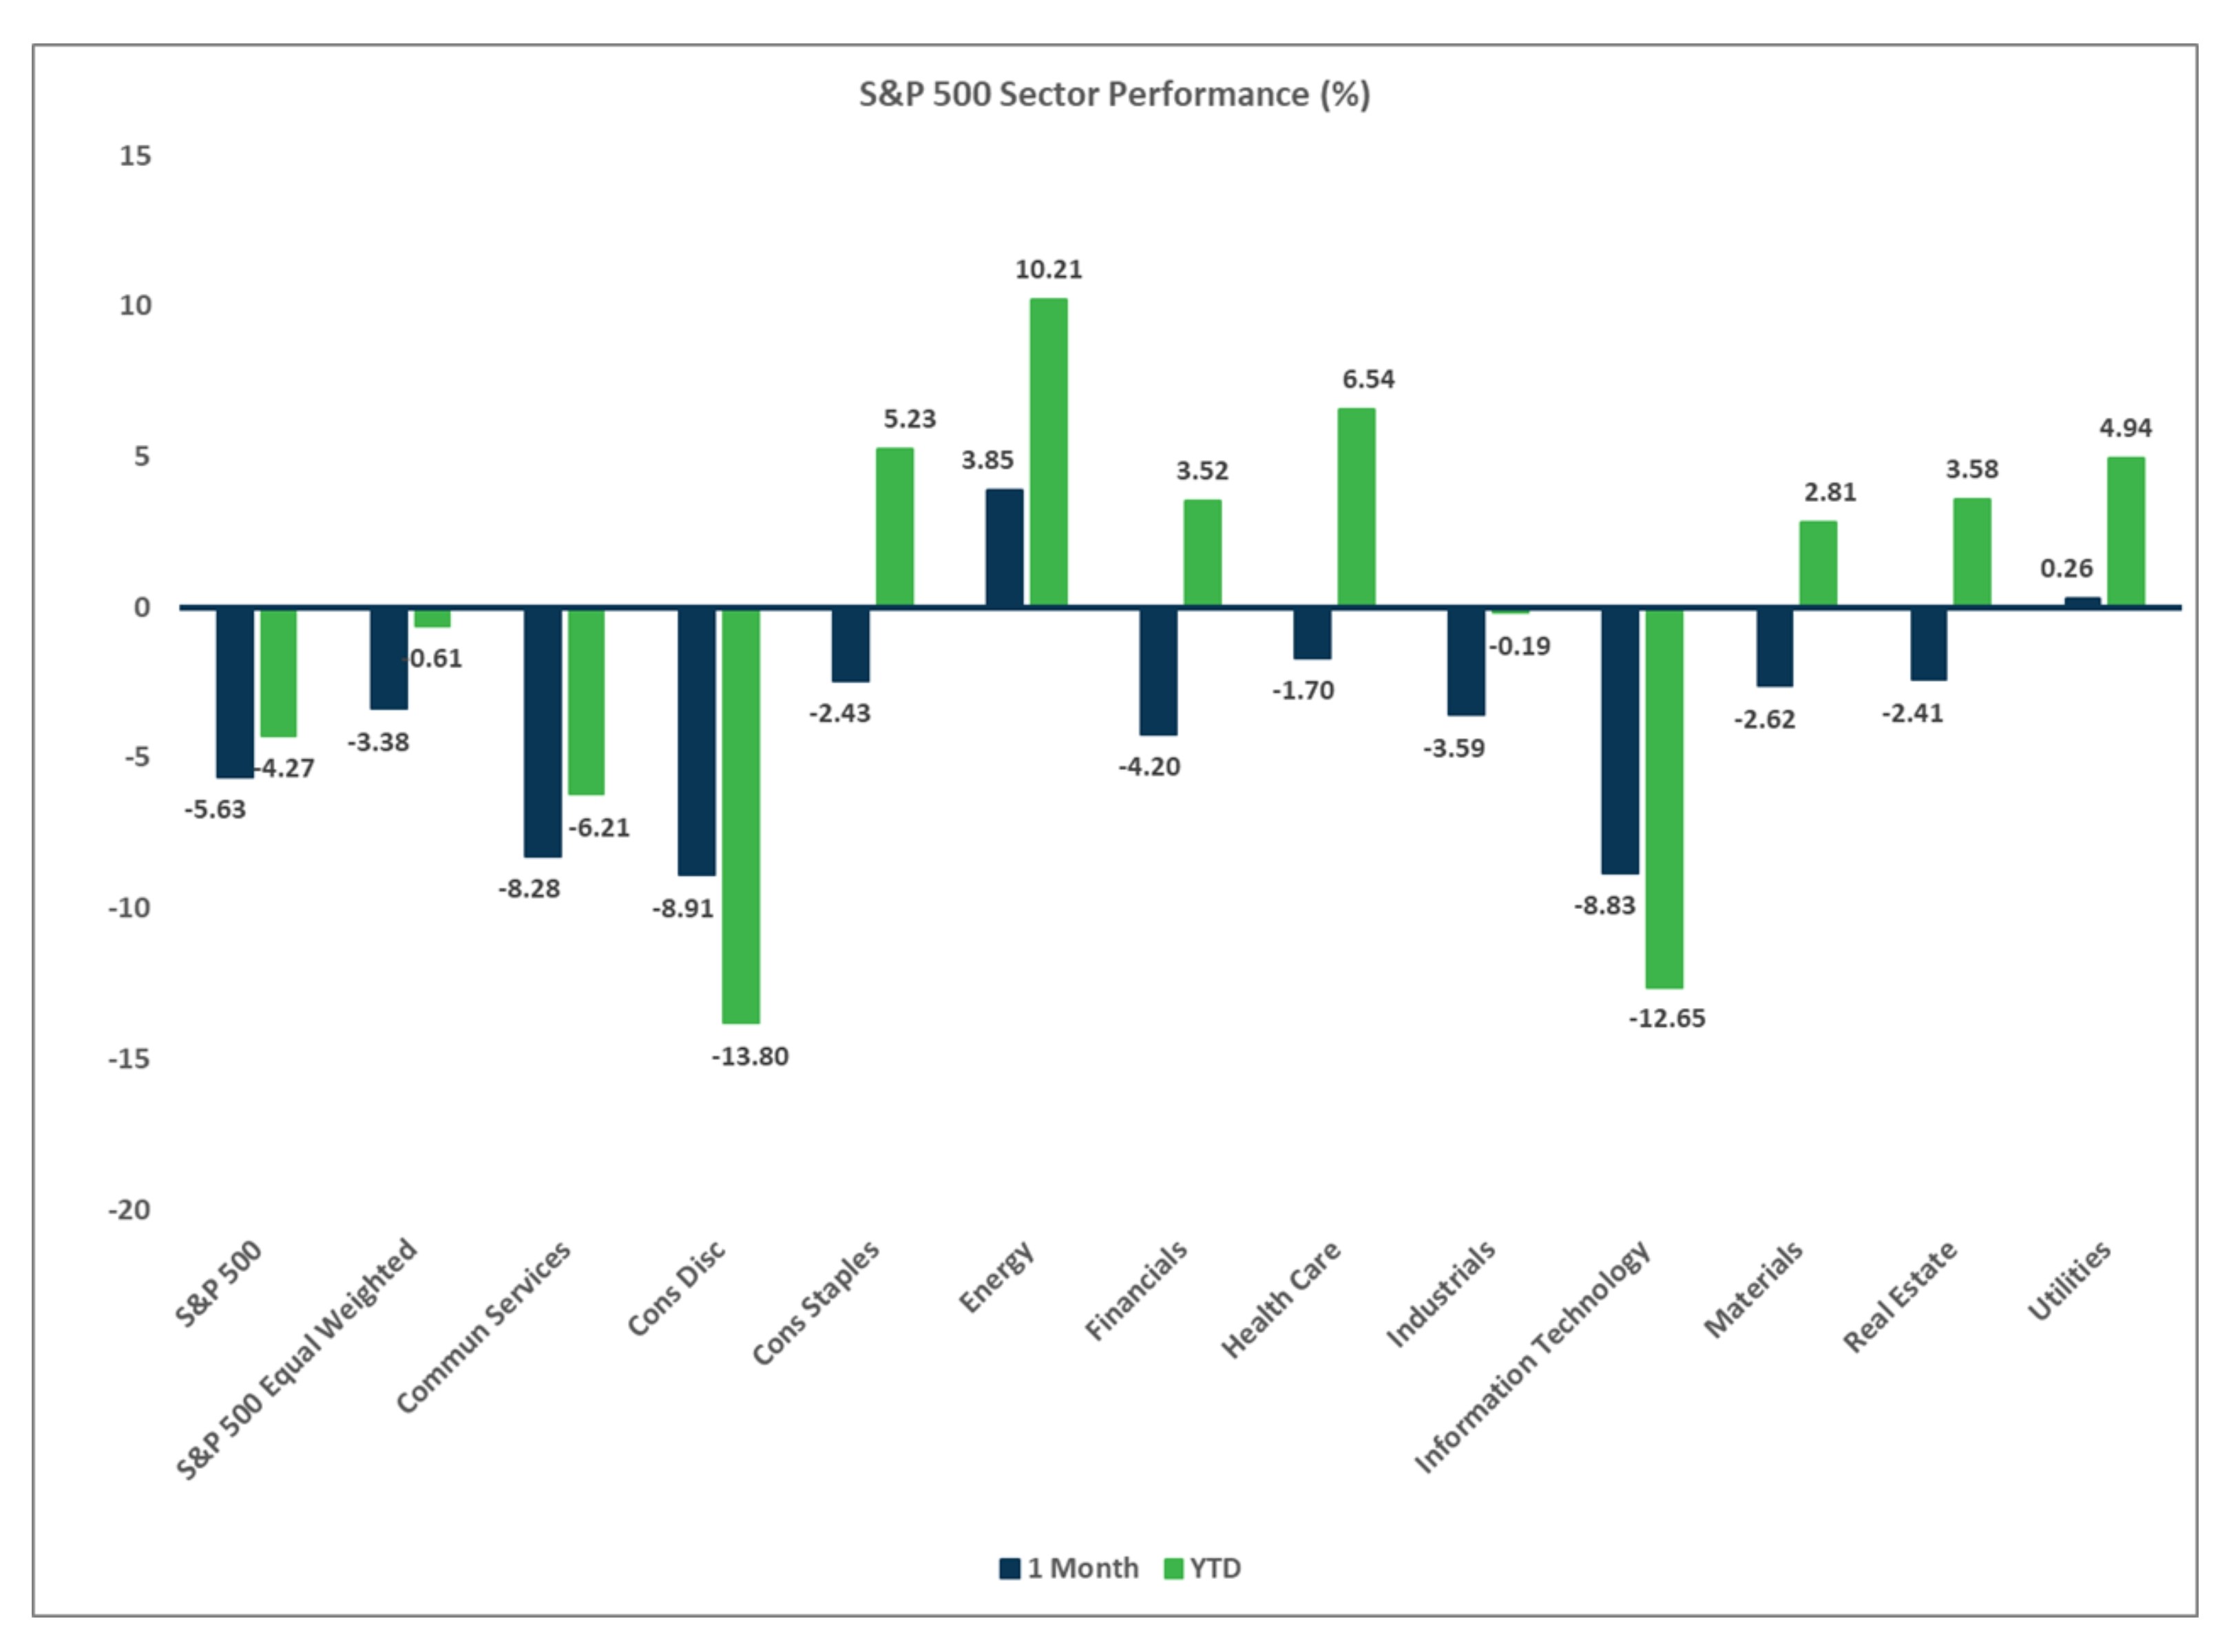
U.S. Equities
- U.S. equities were extremely volatile and suffered losses in March, due largely to uncertainty over tariffs and economic growth.
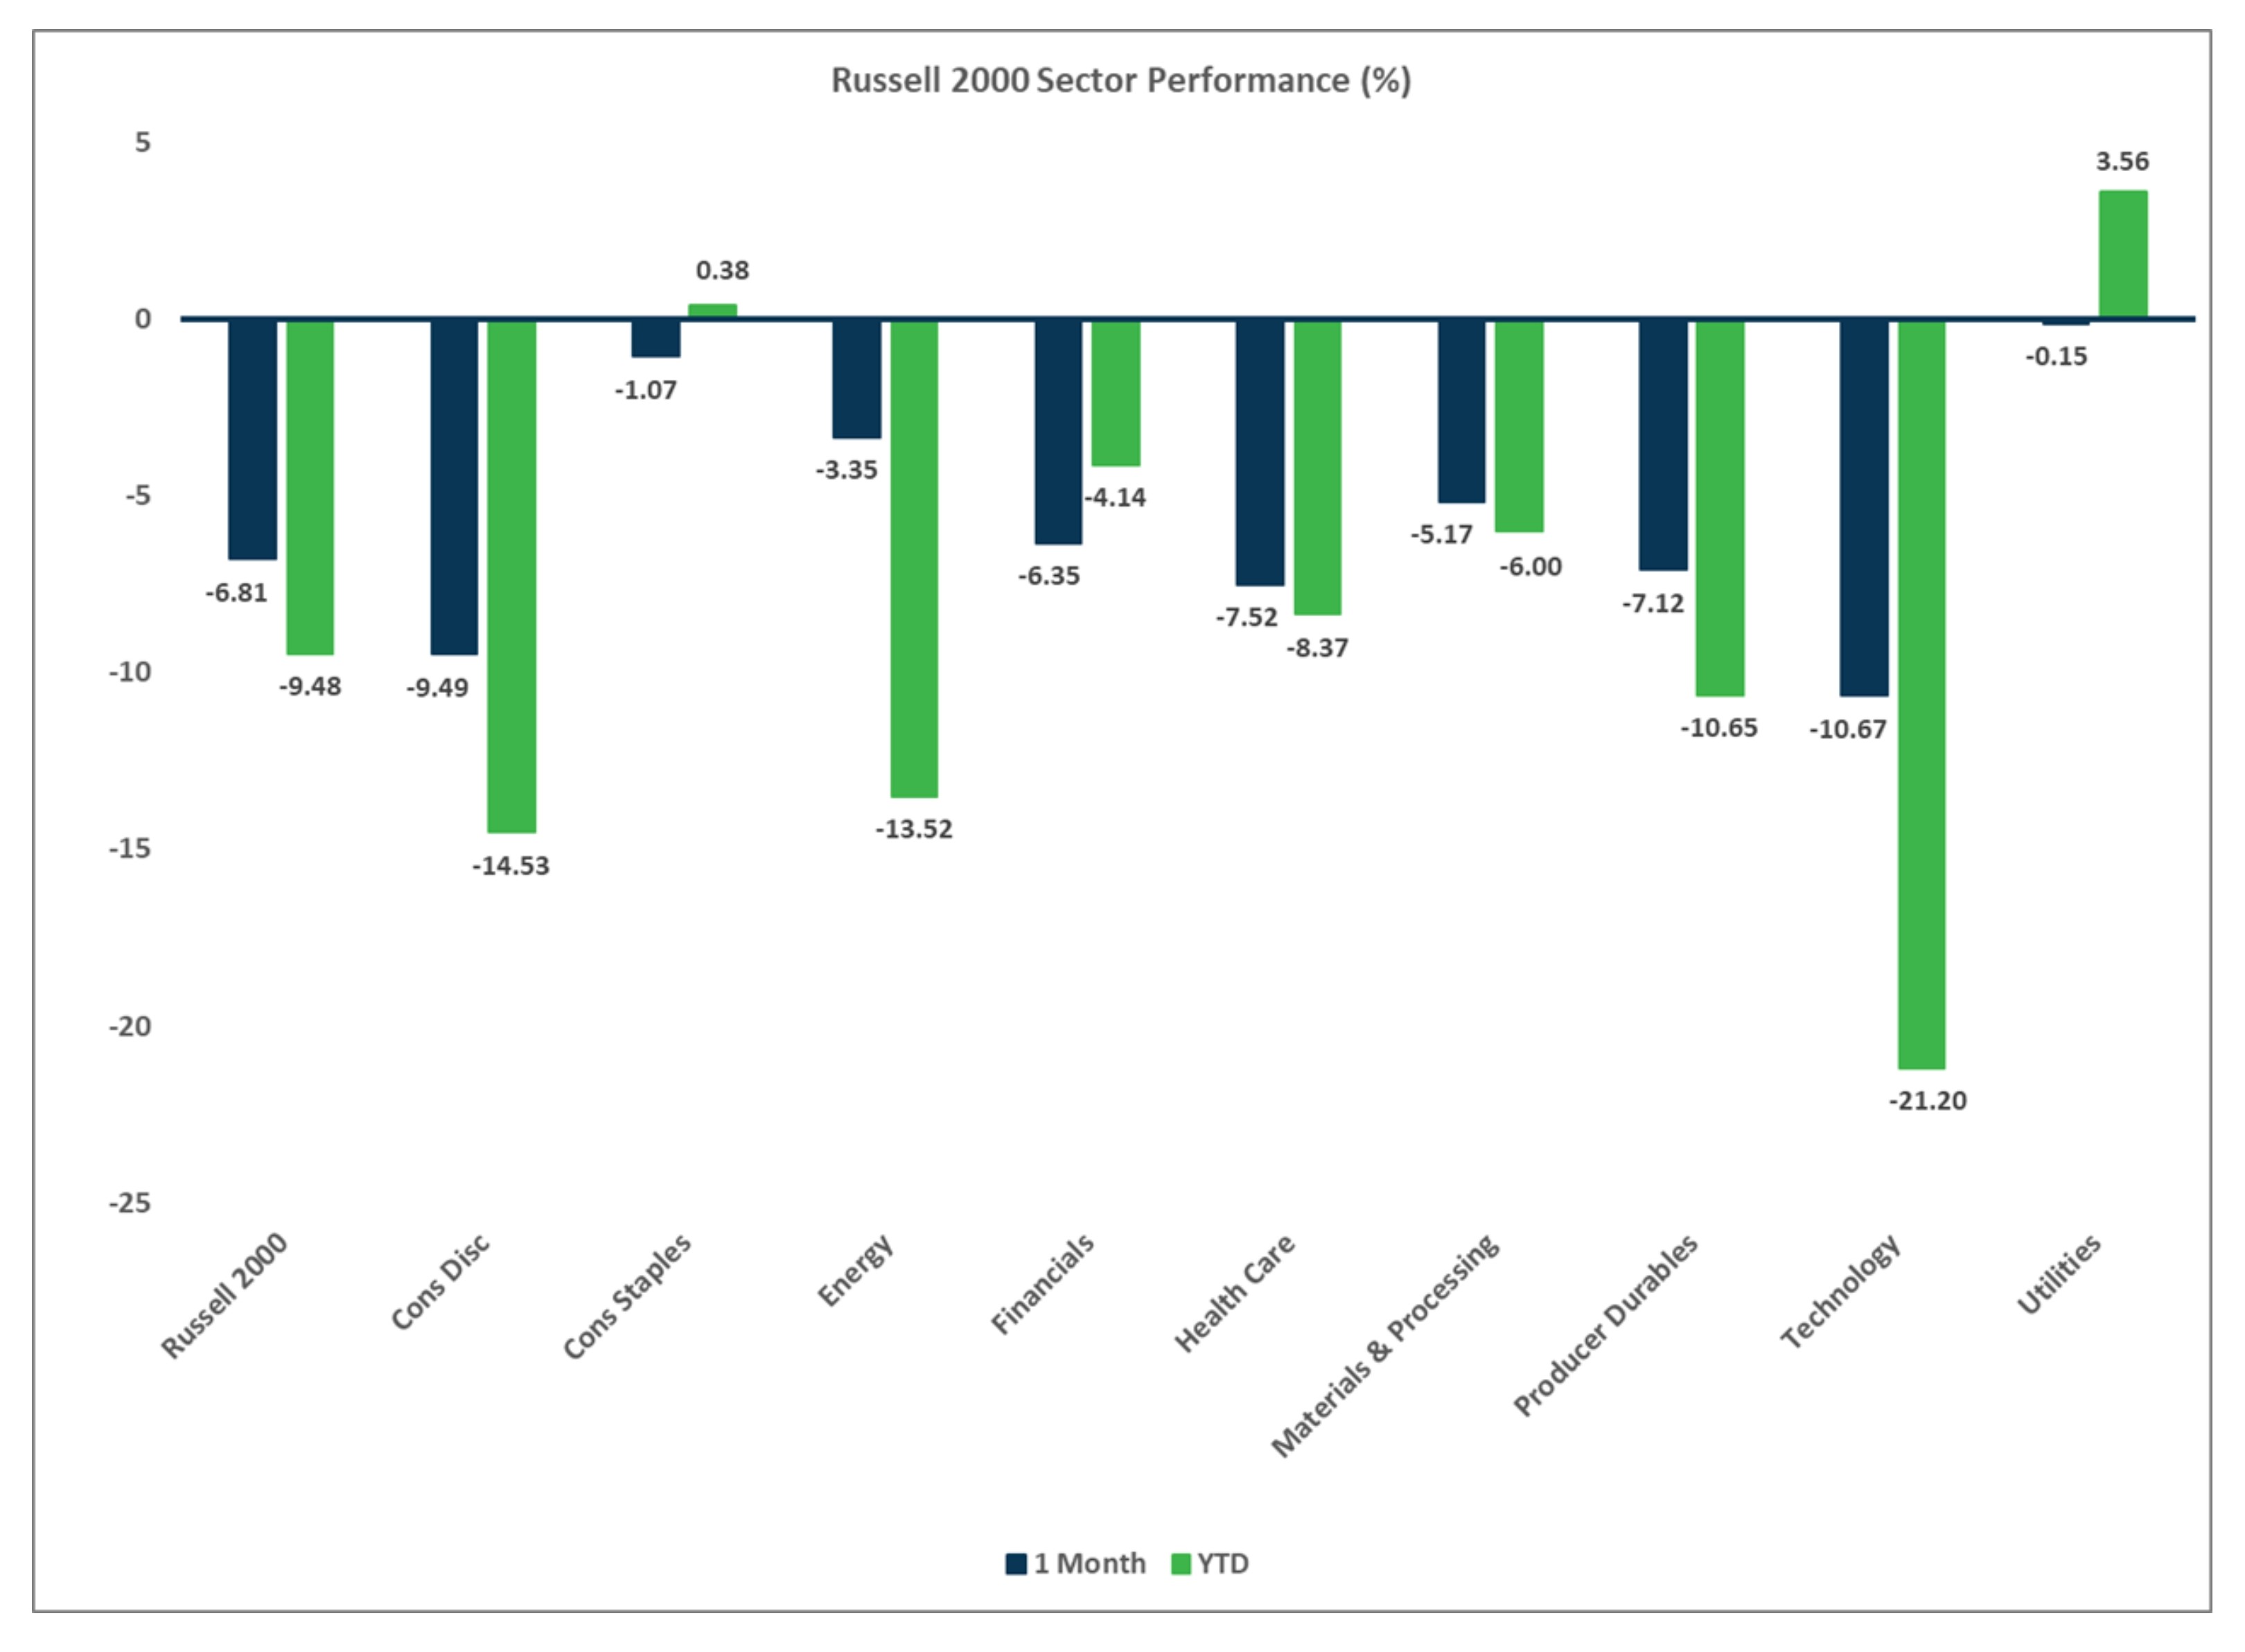
- Value outperformed growth and small caps modestly lagged large caps.
- The Magnificent 7 and other tech stocks have suffered the biggest YTD losses, but it is important to note that these were some of the biggest winners in 2023 and 2024.
Non U.S. Equities
- Developed markets outside the U.S. posted slight losses in March, buoyed by U.S. dollar weakness.
- Unlike what occurred in the U.S., small caps beat large caps within EAFE markets. Value also outperformed growth.
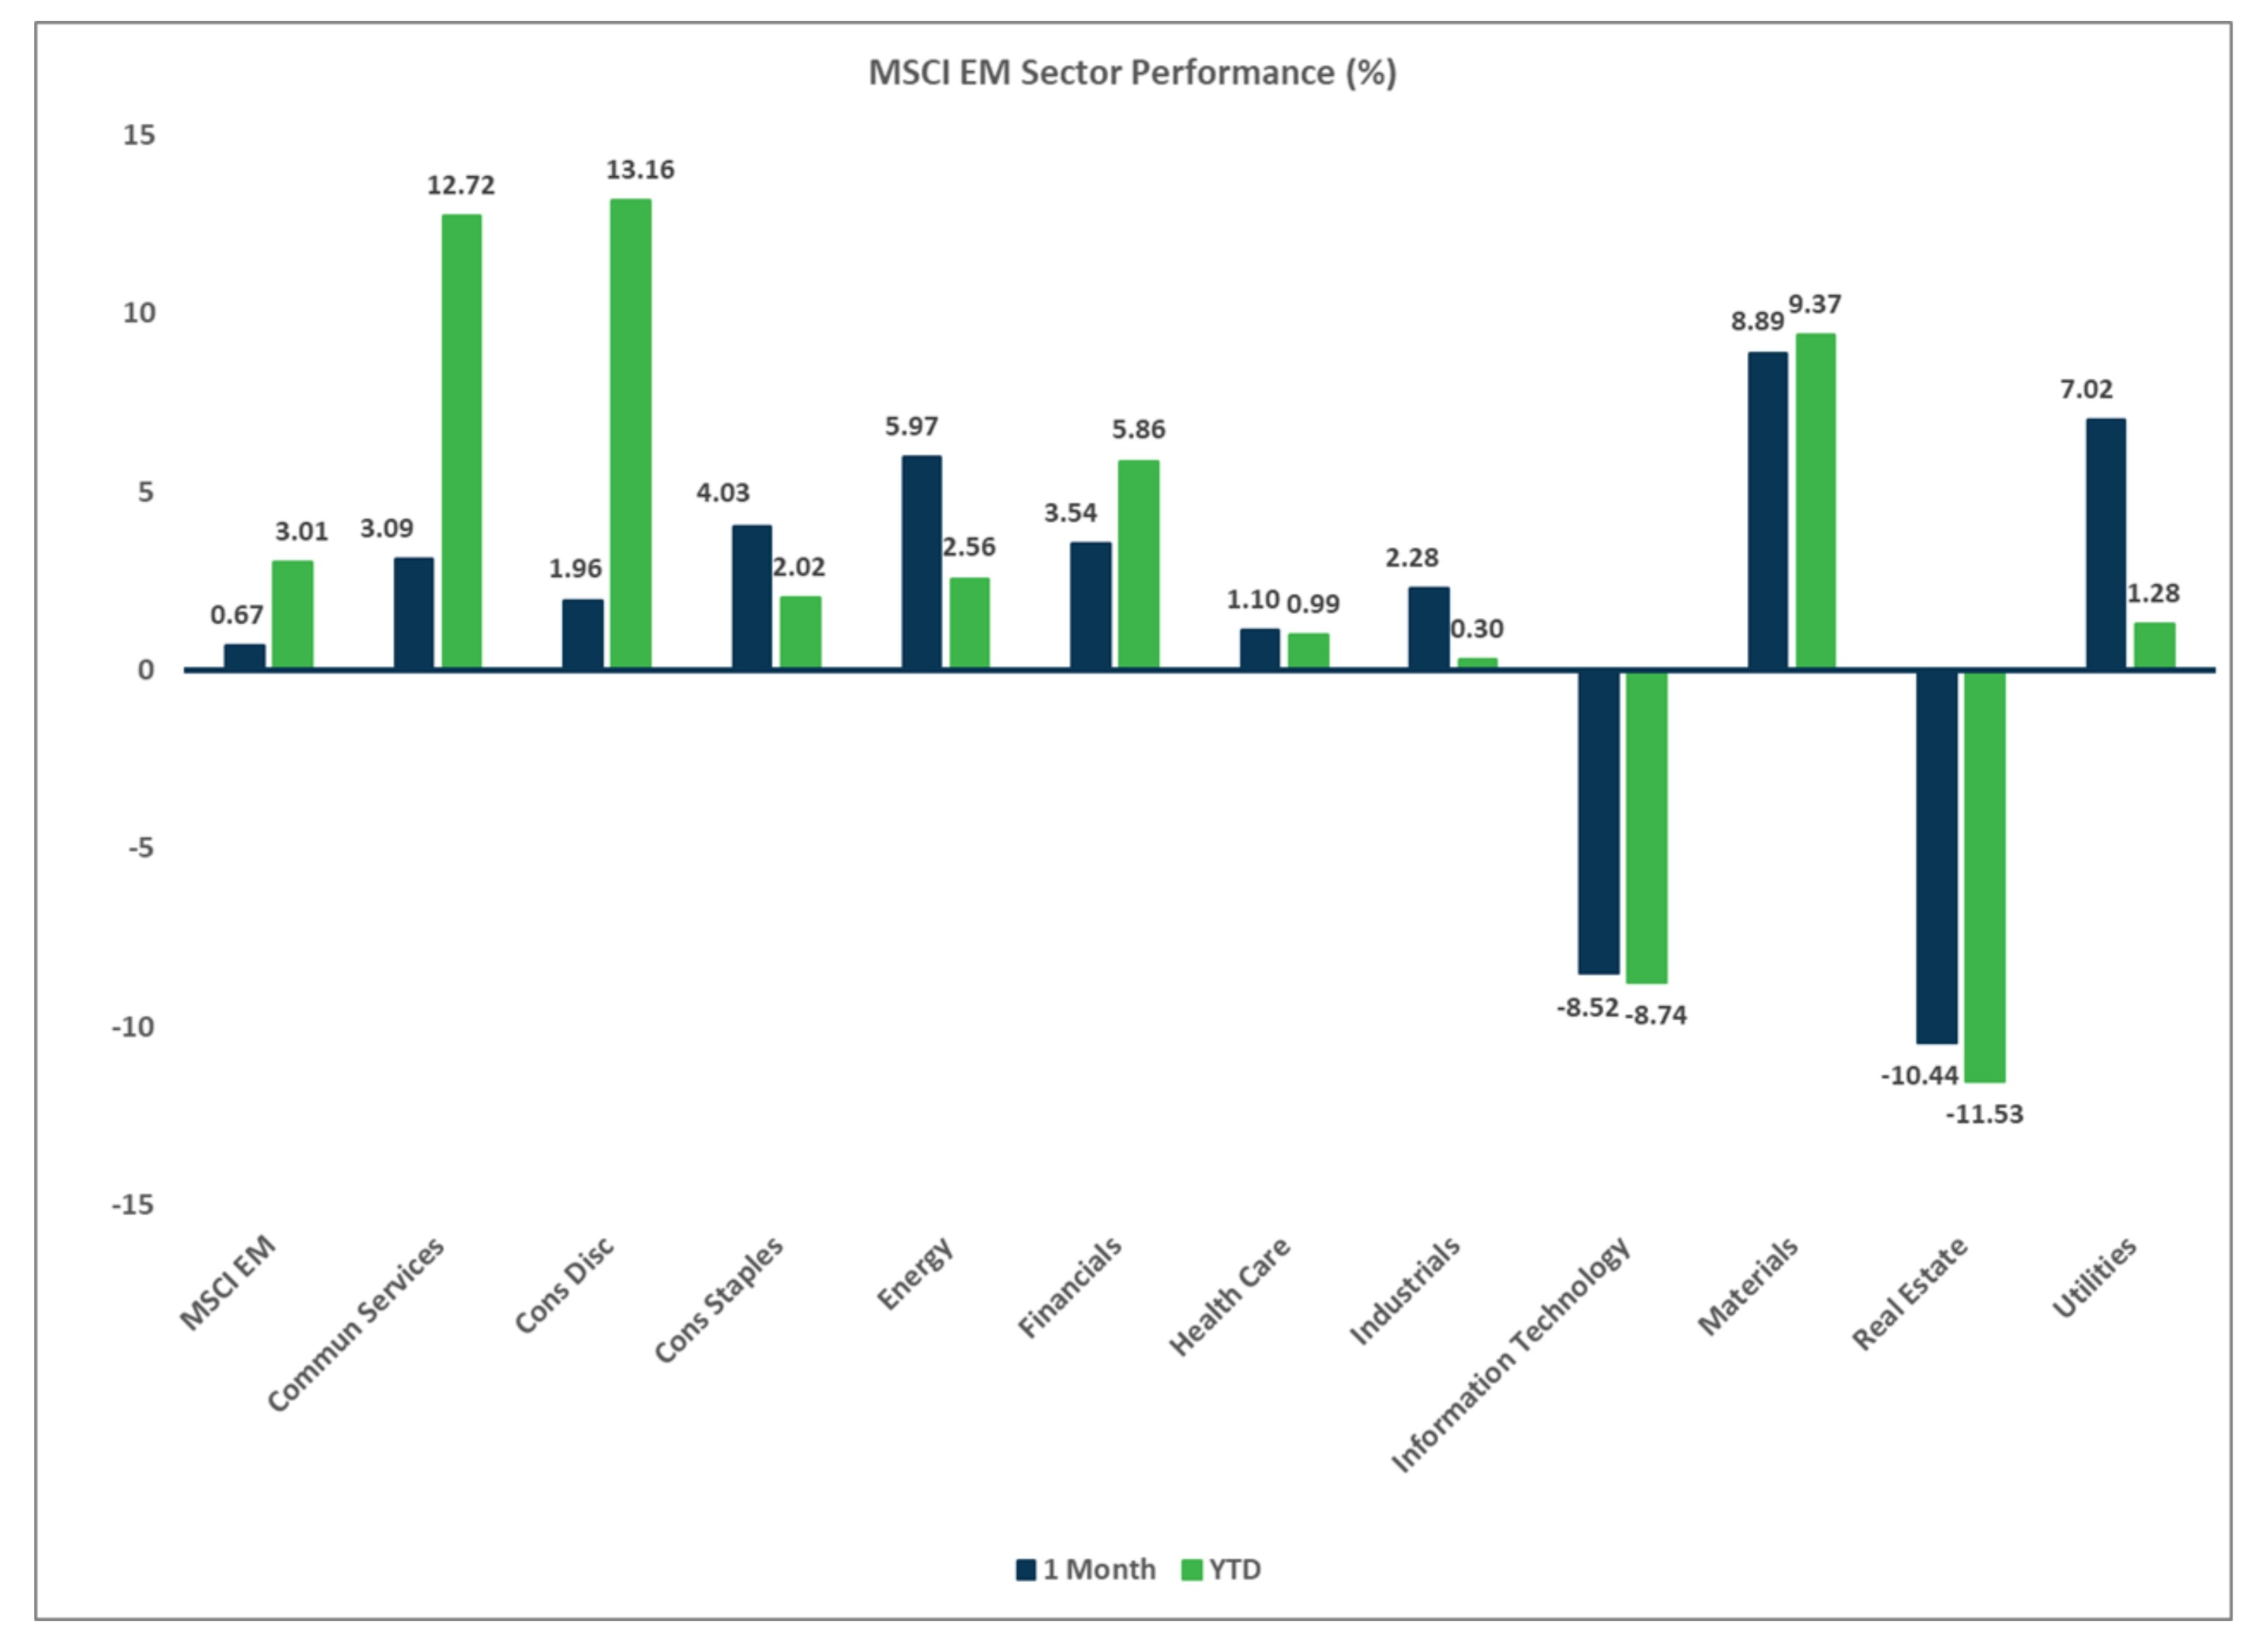
- EM equities outperformed last month driven by strength in China and LatAm.
- USD weakness EM returns.
Sector Performance - S&P 500 (as of 03/31/25)
Sector Performance - Russell 2000 (as of 03/31/25)
Sector Performance - MSCI EAFE (as of 03/31/25)
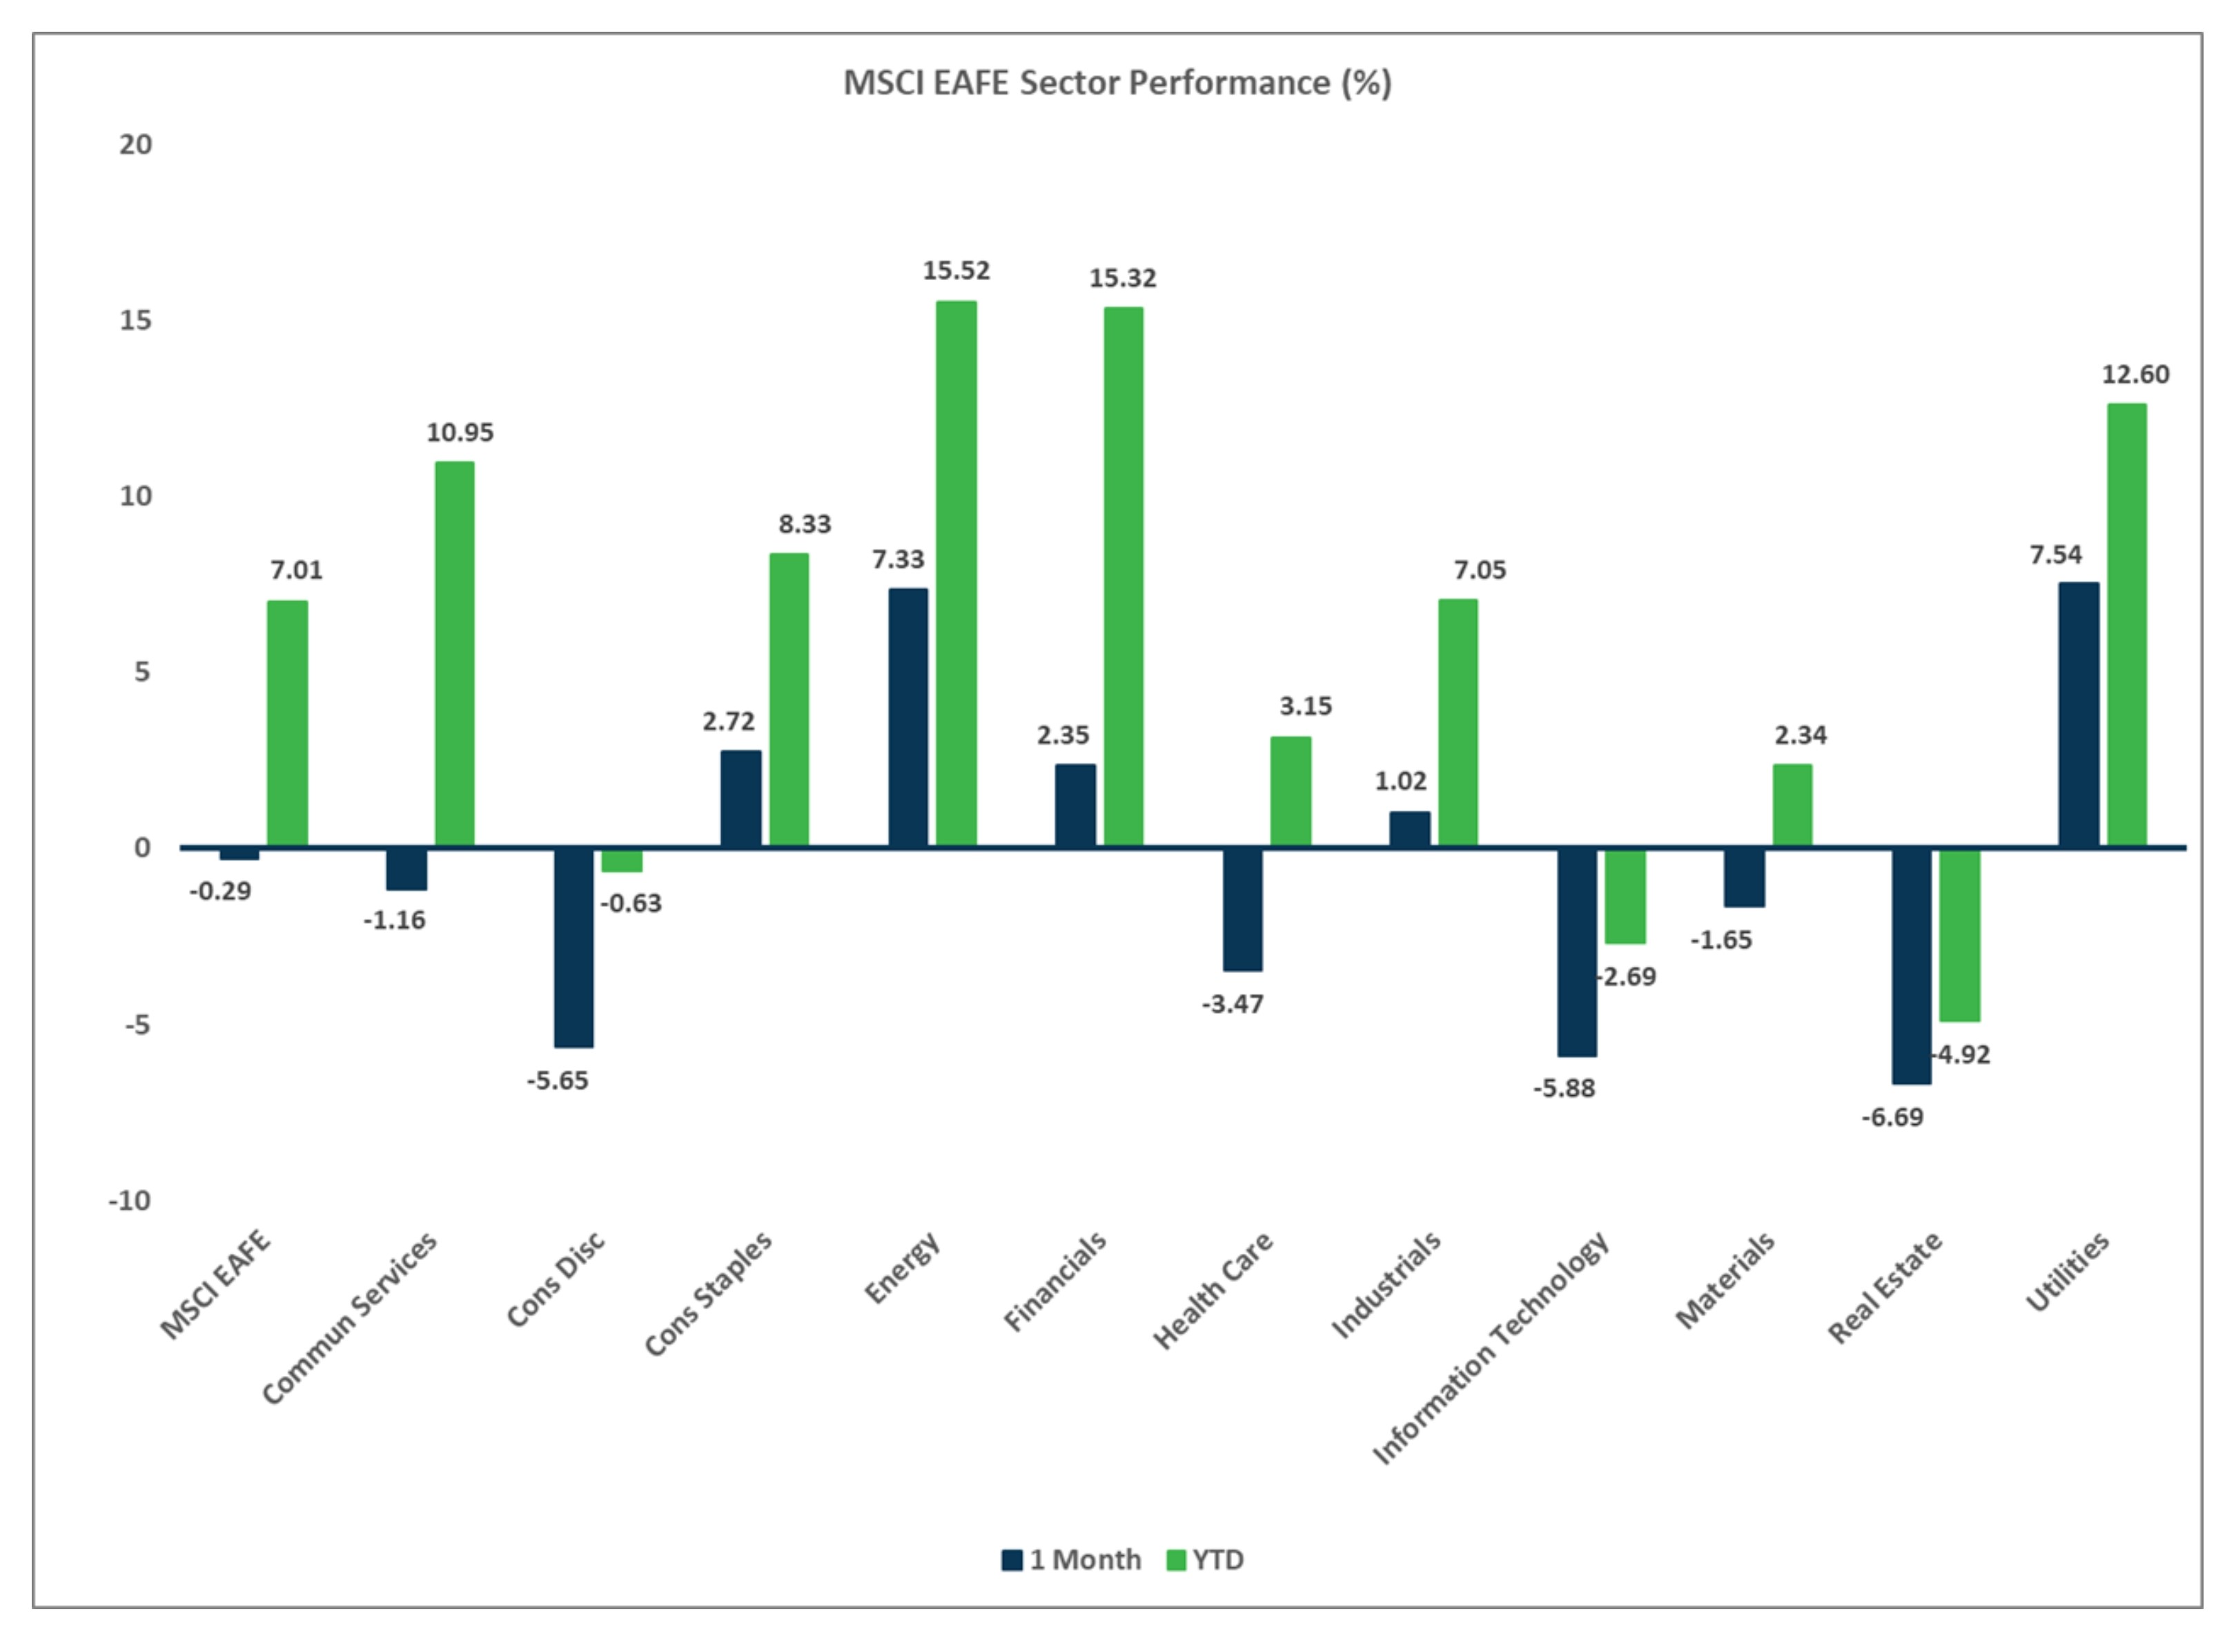
Sector Performance - MSCI EAFE (as of 03/31/25)