Market Flash Report | June 2024

Economic Highlights
United States
- U.S. employers added 272,000 new jobs to the economy in May, well ahead of the 190,000 estimate. The unemployment rate rose to 4% for the first time since January 2022. Job gains were concentrated in health care, government, leisure and hospitality, consistent with recent trends. Average hourly earnings were higher than expected, rising 0.4% M/M and 4.1% Y/Y. One concern is that job gains are coming primarily from government and government-like industries.
- The latest Q2 GDP estimate from the Atlanta Federal Reserve sits at +2.2%. Inflation eased in May with headline Consumer Price Index (CPI) flat M/M or 3.3% Y/Y. Core CPI rose 0.2% M/M or 3.4% Y/Y. Shelter jumped 5.4% Y/Y. The Fed’s preferred inflation gauge, the Personal Consumption Expenditures (PCE) Price Index, rose 2.6% Y/Y in May. Core PCE also rose 2.6% Y/Y last month. PCE has been lower due to factored-in substitutions, but little progress has been made on inflation in recent months.
- The Institute for Supply Management (ISM) Manufacturing PMI fell slightly in June to 48.5 from May’s reading of 48.7. New orders strengthened in June, but production, prices and employment weakened. All major components of the report sit in contraction territory.
- Retail sales rose less than expected in May, increasing by 0.1% from April. April was also revised lower from being flat to a decline of 0.2%. Online retail sales rose 6.8% from a year ago while sales at food and drinking establishments were up by 3.8%. Declines were seen in furniture, building supplies and sporting goods stores.
- New orders for manufactured durable goods in the U.S. rose by 0.1% M/M in May 2024, following a downwardly revised 0.2% increase in April. Orders for non-defense capital goods, excluding aircraft, a closely watched proxy for business spending plans, fell by 0.6% in May after a 0.3% rise in April.
Non-U.S. Developed
- The eurozone’s economic recovery suffered a setback at the end of Q2, based on flash PMI data. New orders decreased for the first time in four months, feeding through to softer expansions in business activity and employment. Meanwhile, business confidence dipped to the lowest since February. Rates of input cost and output price inflation eased to six- and eight-month lows, respectively. Manufacturing fell to a six-month low and service sector activity fell to a three-month low. The rapid decline in new orders suggests that a recovery may be further off than expected. GDP should increase 0.2% Q/Q based on this report.
- The unemployment rate in the eurozone hit a fresh record low of 6.4% in April, down from 6.5% in each of the prior five months. Spain had the highest unemployment rate at 11.7% compared to Germany with the lowest at 3.2%. May inflation increased to 2.6% from 2.4% in April. This move higher comes on the heels of the European Central Bank cutting rates by 25 BPS at its June meeting.
- In a rare move, the Bank of Japan unexpectedly announced another downward revision to economic growth in Q1. The Japanese economy contracted 2.9% in Q1, much weaker than the previous reading of -1.8%. The major highlight of the government’s downward revision for growth early this year was that public investment contracted at a 1.9% rate. Earlier, it was estimated to have grown 3%. Private residential, or housing, fell 2.9% instead of the earlier estimate of a 2.5% contraction.
Emerging Markets
- Factory activity among China’s private firms expanded at the fastest pace in three years, a private gauge showed, suggesting healthier domestic and international demand for Chinese goods. The Caixin manufacturing PMI rose to 51.8 in June, up from 51.7 in May. This marked the sixth straight month of improvement but differed from the official manufacturing PMI released by the National Bureau of Statistics.
- The official manufacturing reading of 49.5 for June was unchanged from the prior month and still in contraction. The Caixin survey covers more export-oriented and consumer-related companies. The official PMI, however, is tilted more towards manufacturers that produce industrial materials.
- Retail sales in China grew 3.7% Y/Y in June, up from a 15-month low of 2.3% in May. This marked the 16th consecutive month of growth in retail trade and the sharpest since February 2024.
- Much of China’s growth this year has come from exports and government investment, rather than consumer spending. Many of the key export items have seen price declines this year, potentially leading to deflation across the global economy. This trend could ultimately lead to lower prices for U.S. consumers in the future.
- India’s economy remains the star performer within emerging markets, with GDP growth well above 7%. The current official estimate of GDP growth in 2023-24 is 8.2%, accelerating from 7% in the preceding year. In June, the Reserve Bank of India pegged the GDP growth rate for FY25 at 7.2%. As the country continues to struggle with high food inflation, overall CPI should remain in the 4-5% range.
Fixed Income
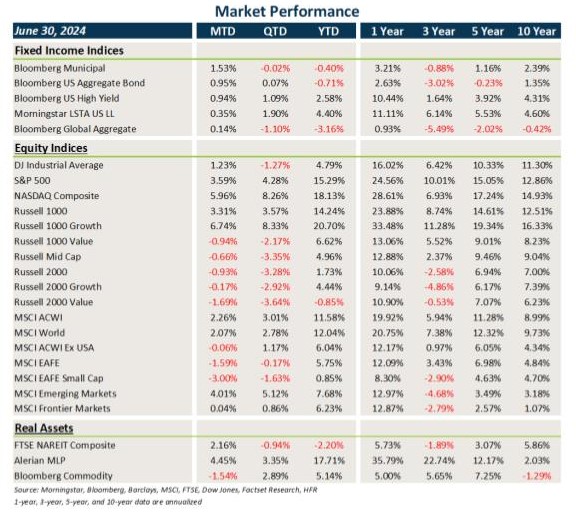
- Treasury and other sovereign debt yields fell in June, leading to solid gains in core fixed income and municipal bonds.
- While credit spreads widened slightly last month, the higher carry/yield was more than sufficient to offset any loss of principal.
- Bonds outside the U.S. benefited from falling yields, but U.S. dollar strength was a significant headwind as the European Central Bank cut rates ahead of the Federal Reserve.
U.S. Equities
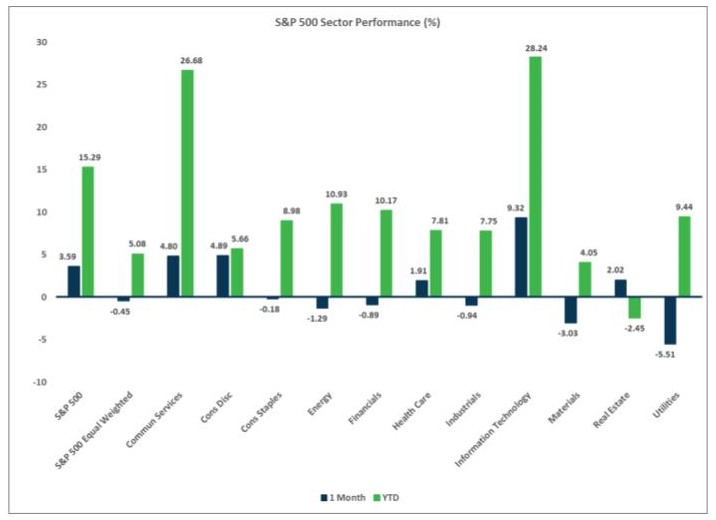
- U.S. equities broadly gained ground with most of the gains coming from large cap stocks and particularly large cap growth.
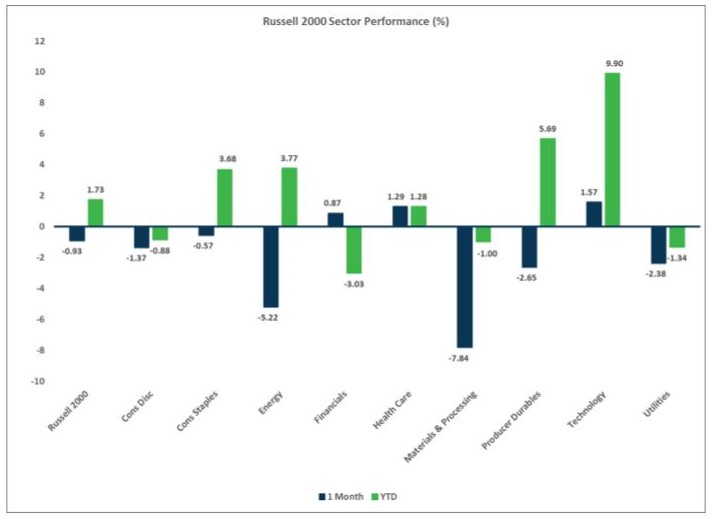
- Value stocks underperformed across all market caps, and small caps lagged large caps by a wide margin.
- U.S. large cap equities posted strong gains through the first half of 2024, but breadth remains fairly narrow and the discrepancies between growth/value and large/small remain firmly entrenched.
Non-U.S. Equities
- Equities outside the U.S. lagged their U.S. counterparts, largely due to strength in the U.S. dollar.
- Similar to what occurred in the U.S., growth beat value and large caps outperformed small caps.
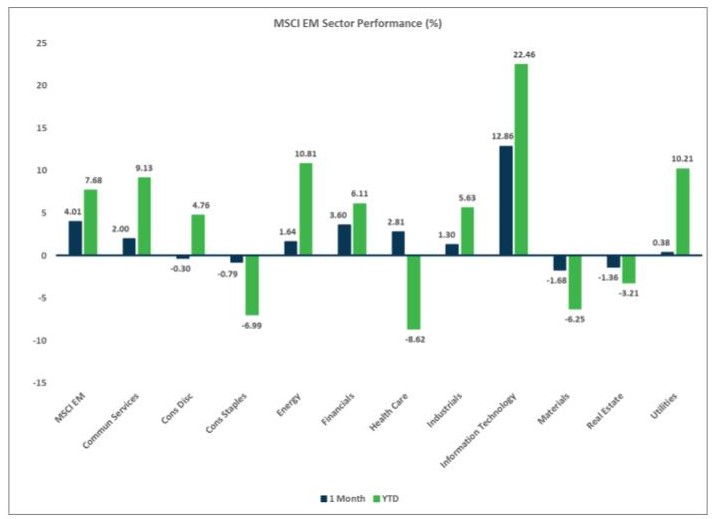
- EMs outperformed most other developed markets due to strength in Asia (excluding China).
Sector Performance - S&P 500 (as of 06/30/24)
Sector Performance - Russell 2000 (as of 06/30/24)
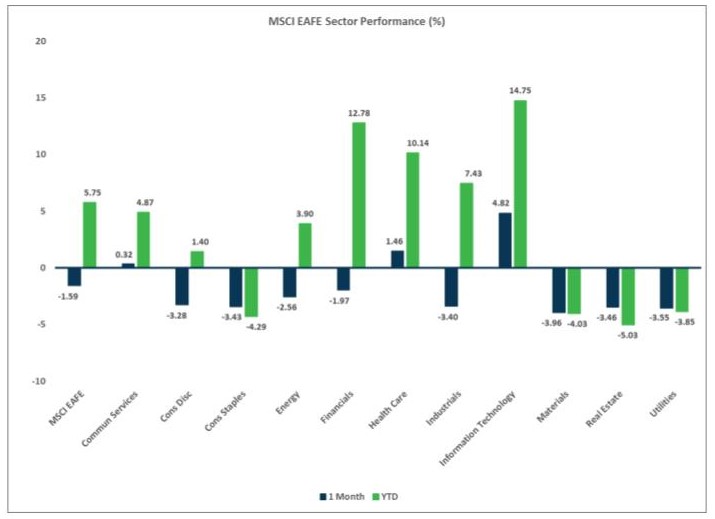
Sector Performance - MSCI EAFE (as of 06/30/24)
Sector Performance - MSCI EM (as of 06/30/24)