
Capital Markets Playbook | Q1 2025

2024 Q4 Summary
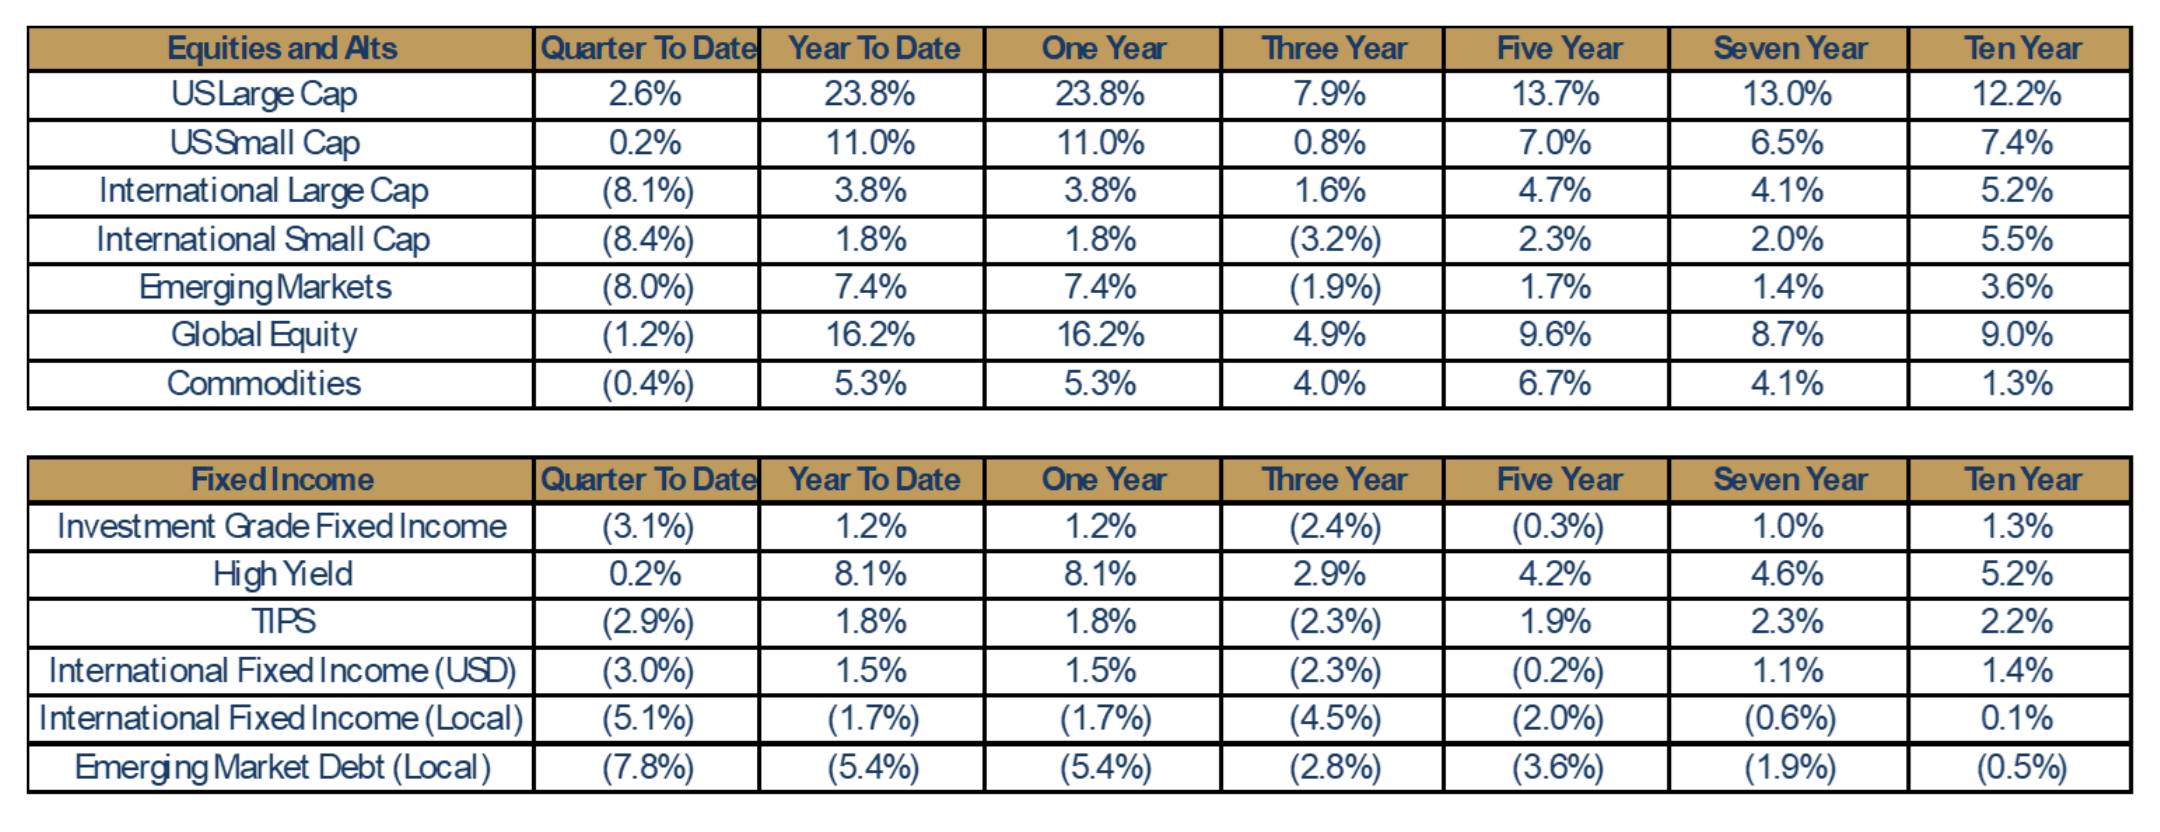
- Equity markets were mixed in the final quarter of 2024.
- Domestic equity asset classes, U.S. Large Cap (+2.6%) and U.S. Small Cap (+0.2%) were up modestly. International equity asset classes, however, underperformed materially: International Large Cap (-8.1%), International Small Cap (-8.4%) and Emerging Markets (-8.0%).
- U.S. Large Cap logged its second consecutive year of +20% performance for the first time since 1998.
- Fixed income markets struggled in the fourth quarter as 2025 rate cut expectations were tempered and risks and uncertainty around inflation moved higher.
- Major fixed income assets were down approximately 3% in the fourth quarter. High Yield was the only fixed income asset class that had slight positive performance (+0.2%).
- For the year, High Yield was the best performing fixed income asset class (+8.1%). Core Fixed Income finished the year +1.2%.
2024: In Review
- 2024 U.S. Macroeconomic review
- Economic growth
- Economic activity in the U.S. was much stronger than anticipated in 2024.
- Initial estimates suggest that U.S. GDP grew close to 3% in 2024, which is nearly 1% higher than the long-term average.
- Consumer spending
- Strong economic growth in 2024 was primarily driven by strong consumer spending.
- Initial estimates suggest that consumer spending growth was around 3% in 2024.
- Unemployment
- Consumer spending in the U.S. remained strong, largely as a result of low unemployment.
- Inflation
- Inflation continued to grind lower in 2024, but remains above the Federal Reserve’s (the Fed) 2% target.
- The Fed’s preferred measure of inflation, the Personal Consumption Expenditures index (PCE), was close to 2.8% at the end of 2024.
- Housing inflation has been the primary driver for inflation not falling further in 2024.
- Interest rates and monetary policy
- The Fed cut short term interest rates by a total of 1% in 2024. The Fed’s overnight policy rate ended the year at 4.00% - 4.25%.
- Long-term rates moved higher in 2024, as markets began to worry about how new policies will impact inflation and U.S. debt/deficits.
- Economic growth
- 2024 Equity Market Review
- Global equity markets posted the second consecutive year of strong returns.
- U.S. Large Cap equity
- U.S. Large Cap equities were up 24% in 2024, largely as a result of strong performance from “Magnificent Seven” stocks.
- Outperforming S&P 500 sectors included Info Tech (+36.6%), Communication Services (+40.2%) and Financials (+30.6%)
- Underperforming S&P 500 sectors included Materials (0.0%), Real Estate (+5.2%), Energy (+5.8%) and Health Care (+2.6%)
- U.S. Large Cap equities were up 24% in 2024, largely as a result of strong performance from “Magnificent Seven” stocks.
- U.S. Small Cap equity
- U.S. Small Cap equities were up 11% in 2024.
- Outperforming sectors included Info Tech (+23.6%), Financials (+16.6%), Communication Services (+28.1%) and Consumer Staples (+21.2%)
- Underperforming sectors included Health Care (+3.0%), Materials (+3.6%) and Utilities (+7.3%)
- U.S. Small Cap equities were up 11% in 2024.
- International equity
- International equities were up 4.3% in 2024.
- Outperforming sectors included Financials (+21.8%), Communication Services (+11.7%) and Industrials (+10.1%)
- Underperforming sectors included Materials (-12.6%), Energy (-10.0%) and Consumer Staples (+1.9%)
- International equities were up 4.3% in 2024.
- Emerging Markets
- Emerging Market equities were up over 7% in 2024.
- Outperforming sectors included Info Tech (21.0%), Communication Services (+16.1%) and Consumer Discretionary (+12.0%)
- Underperforming sectors included Materials (-19.3%), Consumer Staples (-10.8%) and Energy (-2.7%).
- Emerging Market equities were up over 7% in 2024.
- 2024 Fixed Income Review
- U.S. Treasury markets experienced significant volatility in 2024 due to changing expectations for monetary policy, stickier-than-expected inflation and growing U.S. debt and deficits.
- Short U.S. Treasuries
- Although short dated Treasuries were more volatile than normal in 2024, yields along the very short end of the curve declined as the Federal Reserve cut short-term interest rates.
- Yields for 30-day T-bills declined about 1.0% in 2024, yields for 1 Year Treasuries were about 0.50% lower.
- Intermediate and Long U.S. Treasuries
- Longer dated U.S. Treasury yields moved higher in 2024 as investors began to price in the potential for sticker than expected inflation and growing U.S. debt and deficits.
- 3 Year US Treasury Yields were about 40bps higher, 5 Year U.S. Treasury yields were nearly 50bps higher, and 10 Year US Treasury yield increased more than 60bps in 2024 and ended the year north of 4.50%.
- Although short dated Treasuries were more volatile than normal in 2024, yields along the very short end of the curve declined as the Federal Reserve cut short-term interest rates.
- Corporate Credit was surprisingly resilient in 2024 as credit investors remained constructive on high quality debt investments.
- Corporate credit spreads remained near historic lows as consumer spending and economic growth surprised to the upside.
- Defaults in lower credit quality debt picked up slightly in 2024, but the overall default rate remains low by historical standards.
- Short U.S. Treasuries
- U.S. Treasury markets experienced significant volatility in 2024 due to changing expectations for monetary policy, stickier-than-expected inflation and growing U.S. debt and deficits.
2025: Macroeconomic Expectations
- “Base Case” Expectations of 2025 U.S. Economic Growth (GDP) by Component:
- Consumer Spending “Base Case”
- Markets expect the consumer spending to grow about 2.5% in 2025, which is about 1% lower than the long-term average growth rate.
- Business investment “Base Case”
- Business investment spending growth is expected to grow about 2.6% in 2025, which is about 2.5% lower than the long-term average business investment growth rate.
- Government spending “Base Case”
- Government spending is expected to grow at about 1.7% in 2025, which is about 0.3% lower than the long-term average government spending growth rate.
- Housing “Base Case”
- Housing is expected to grow at about 0.5% in 2025, which is about 4% lower than the long-term average housing growth rate.
- Net Exports “Base Case”
- Net exports are expected to grow by about 1% in 2025, which is about 1.5% lower than the long-term average net export growth rate.
- Consumer Spending “Base Case”
- Risks to U.S. Economic Growth “Base Case”
- Should consumer spending grow at a slower rate than expected, the U.S. economy will underperform in 2025.
- A material increase in unemployment in the U.S., an unanticipated spike in inflation or an unexpected increase in interest rates are just a few examples of events that could lead to a more cautious consumer.
- Economic Growth Takeaways:
- Slower consumer spending growth, slower business spending growth and slower government spending growth will make it challenging for the U.S. to repeat its strong economic growth experienced in 2024.
- That said, consumer spending (which makes up nearly 70% of GDP) is expected to remain strong enough for GDP to grow near its long-term average growth rate of 2.1% in 2025.
- Unemployment “Base Case”
- Unemployment is expected to tick slightly higher but remain relatively low in 2025.
- Unemployment, currently at 4.2%, may increase to around 4.5% by the end of 2025.
- Unemployment is expected to tick slightly higher but remain relatively low in 2025.
- Inflation “Base Case”
- Inflation is expected to decline but remain above the Fed’s 2% target in 2025.
- Personal Consumption Expenditures (PCE) inflation – the Fed’s preferred measure of inflation – is expected to decline from 2.8% to about 2.5% in 2025.
- Inflation is expected to decline but remain above the Fed’s 2% target in 2025.
- Interest rates “Base Case”
- The slope of the U.S. Treasury yield curve should steepen in 2025.
- Short-term interest rates are expected to decline by about 0.5% as the Fed continues with its monetary policy normalization effort.
- Short-term interest rates are expected to decline by about 0.5% as the Fed continues with its monetary policy normalization effort.
- The slope of the U.S. Treasury yield curve should steepen in 2025.
- Risks to “Base Case” expectations:
- Unemployment risks
- Immigration reform could create a significant increase in unemployment across selected industries and push the aggregate unemployment rate above 5%.
- Inflation risks
- Tariffs on imported goods could push inflation higher, particularly if there are “tit for tat” tariffs between the U.S. and its trading partners.
- Interest rate risks
- Mounting concerns over U.S. debt and deficits could lead investors to demand higher yields (even if inflation is moving lower).
- Unemployment risks
- Takeaway:
- Slightly higher unemployment, stickier-than-expected inflation and higher long-term interest rates are not expected to slow economic growth in a material way in 2025.
2025 Expectations: Economic Growth
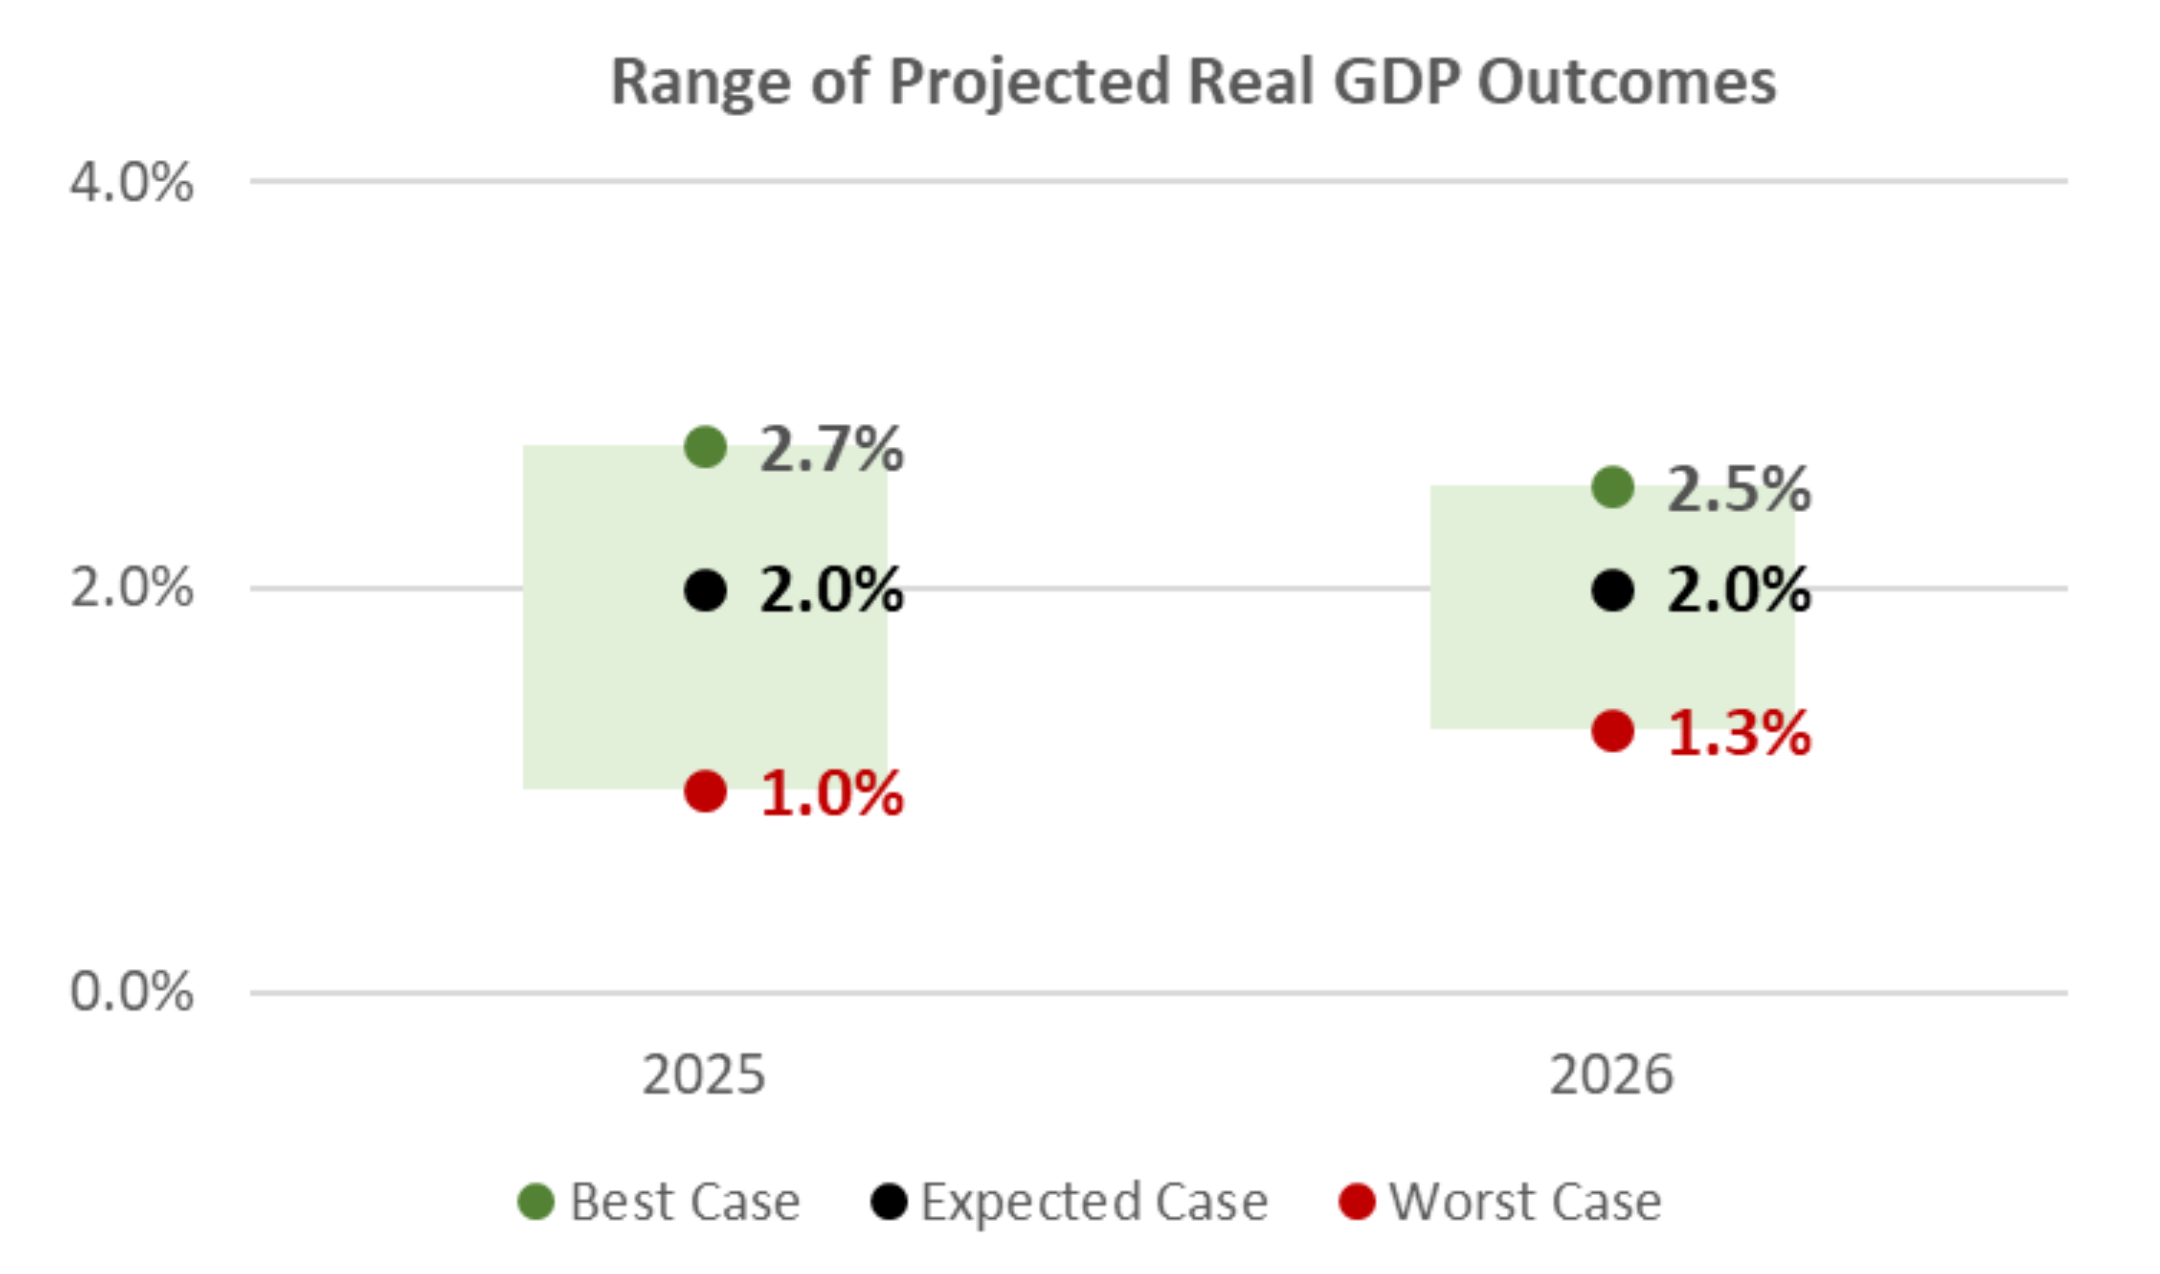
- 2025 U.S. economic growth may not be as strong as it was in 2024, but another year of solid growth is expected.
- Expectations for continued low unemployment and strong consumer spending may allow the U.S. economy to grow at a faster clip than most developed economies in 2025.
- Scenarios:
- Best Case
- Economic activity in the U.S. is about 0.5% above its long-term trend rate over the next two years.
- Expected Case
- Economic activity in the U.S. is consistent with its long-term growth rate over the next two years.
- Worst Case
- Economic activity is about 0.5%-1.0% below its long-term trend rate over the next two years.
- Best Case
2025 Expectations: Unemployment
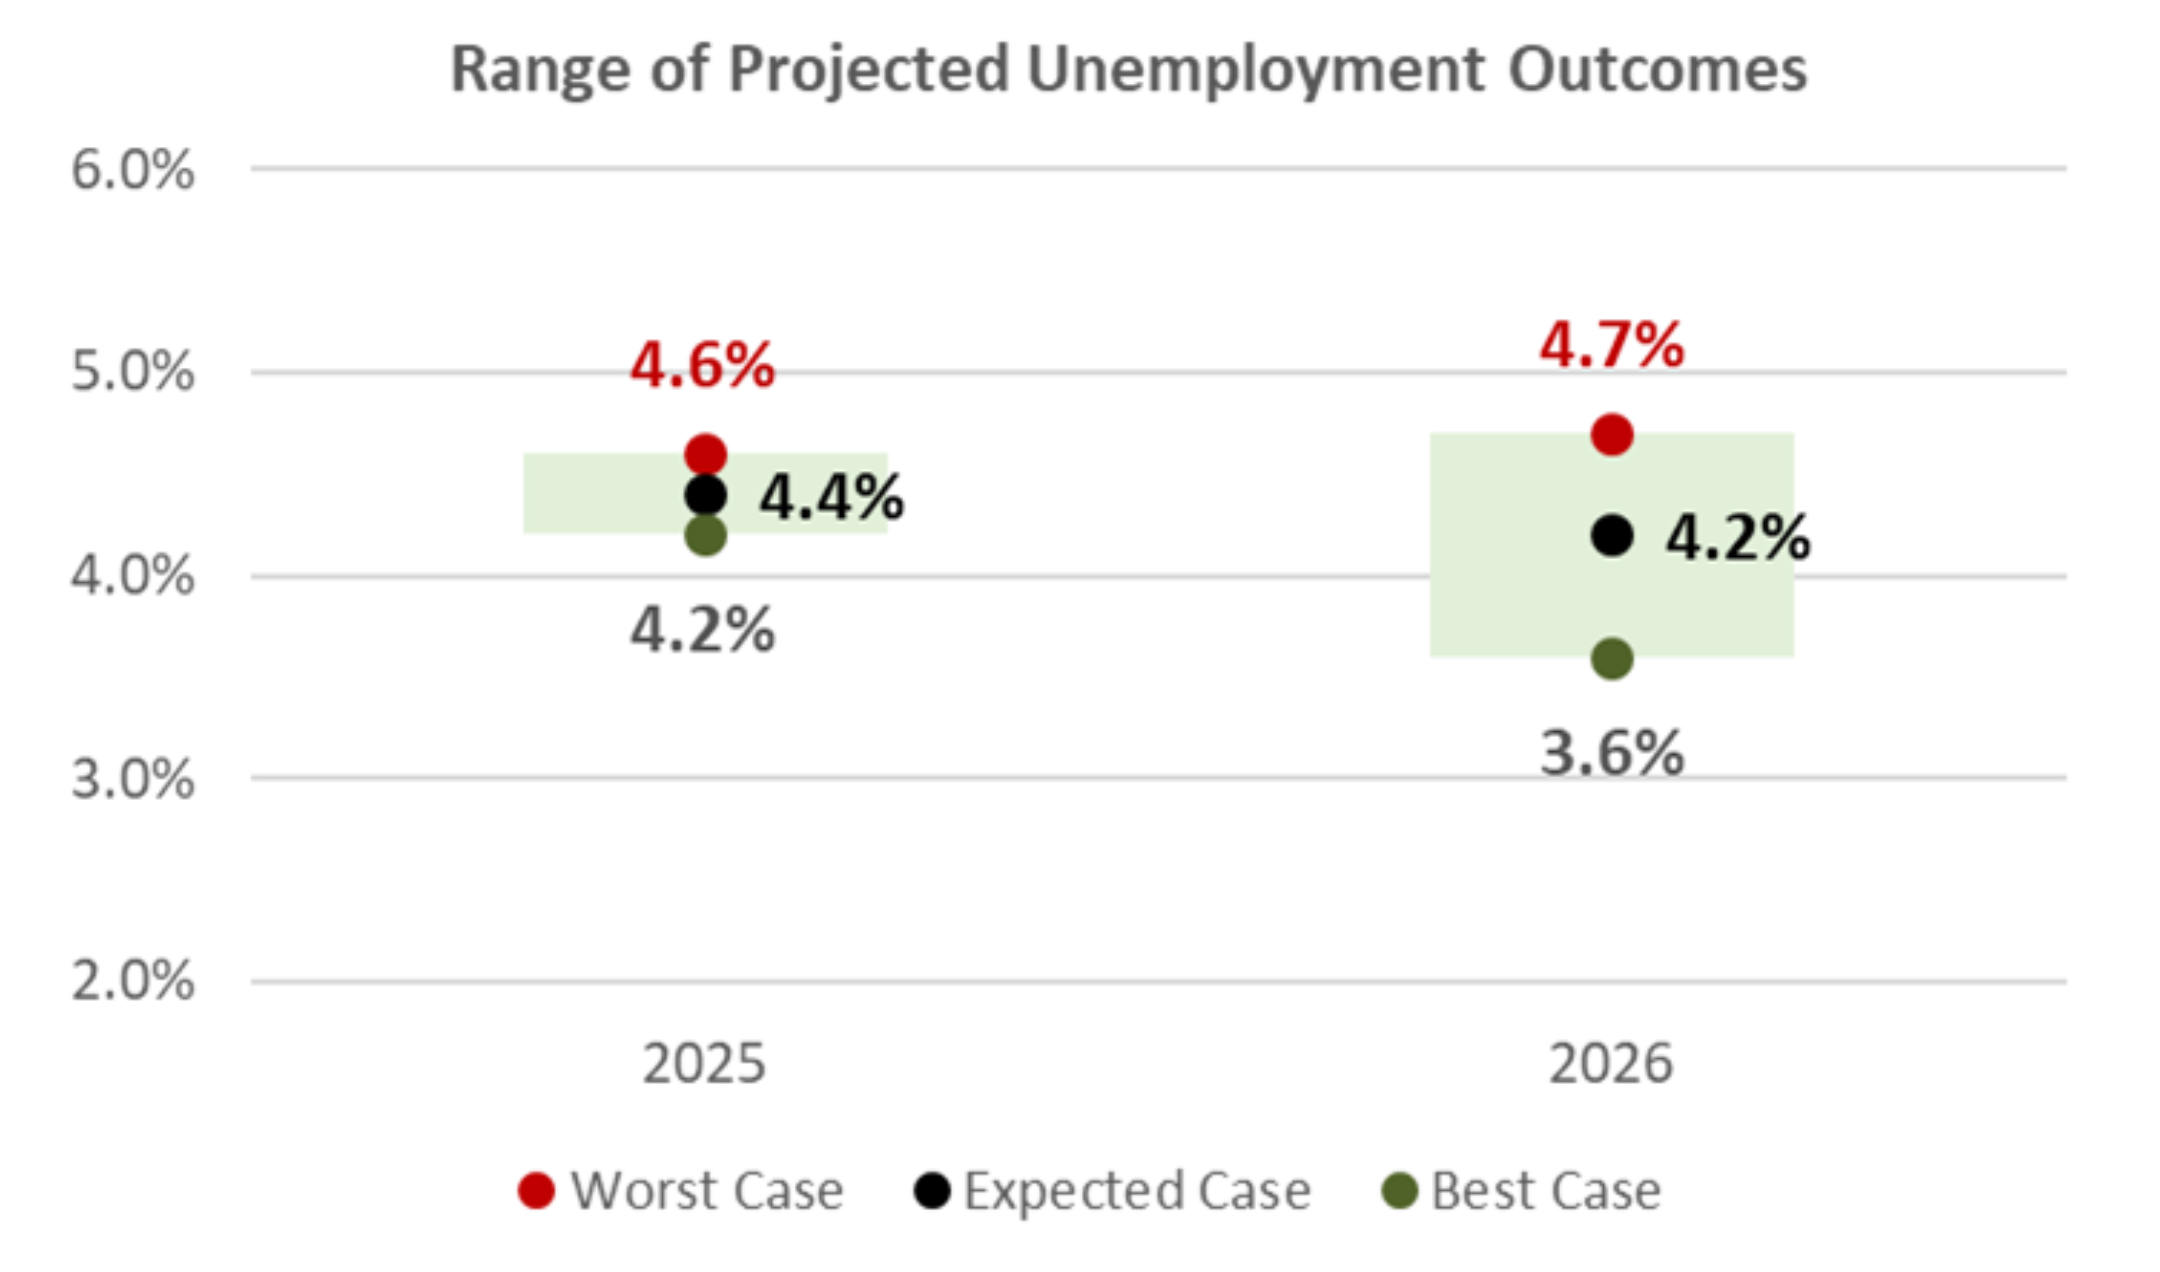
- Unemployment in the U.S. is expected to remain well below its long-term average in 2025, despite the possibility of immigration reform.
- Immigration reform could have a negative impact on labor supply across selected industries, but a broad-based labor shortage is not expected.
- Industries that may be negatively impacted by immigration reform include agriculture, hospitality and entertainment, residential construction and selected service industries.
Scenerios:
- Best Case
- Unemployment declines slightly from its current level and remains near historical lows over the next two years.
- Expected Case
- Unemployment remains largely unchanged as the U.S. economy grows close to its longer-term trend rate.
- Worst Case
- Unemployment approaches 5.0% by the end of 2025 as a result of immigration reform and/or meaningfully slower economic growth.
2025 Expectations: Inflation
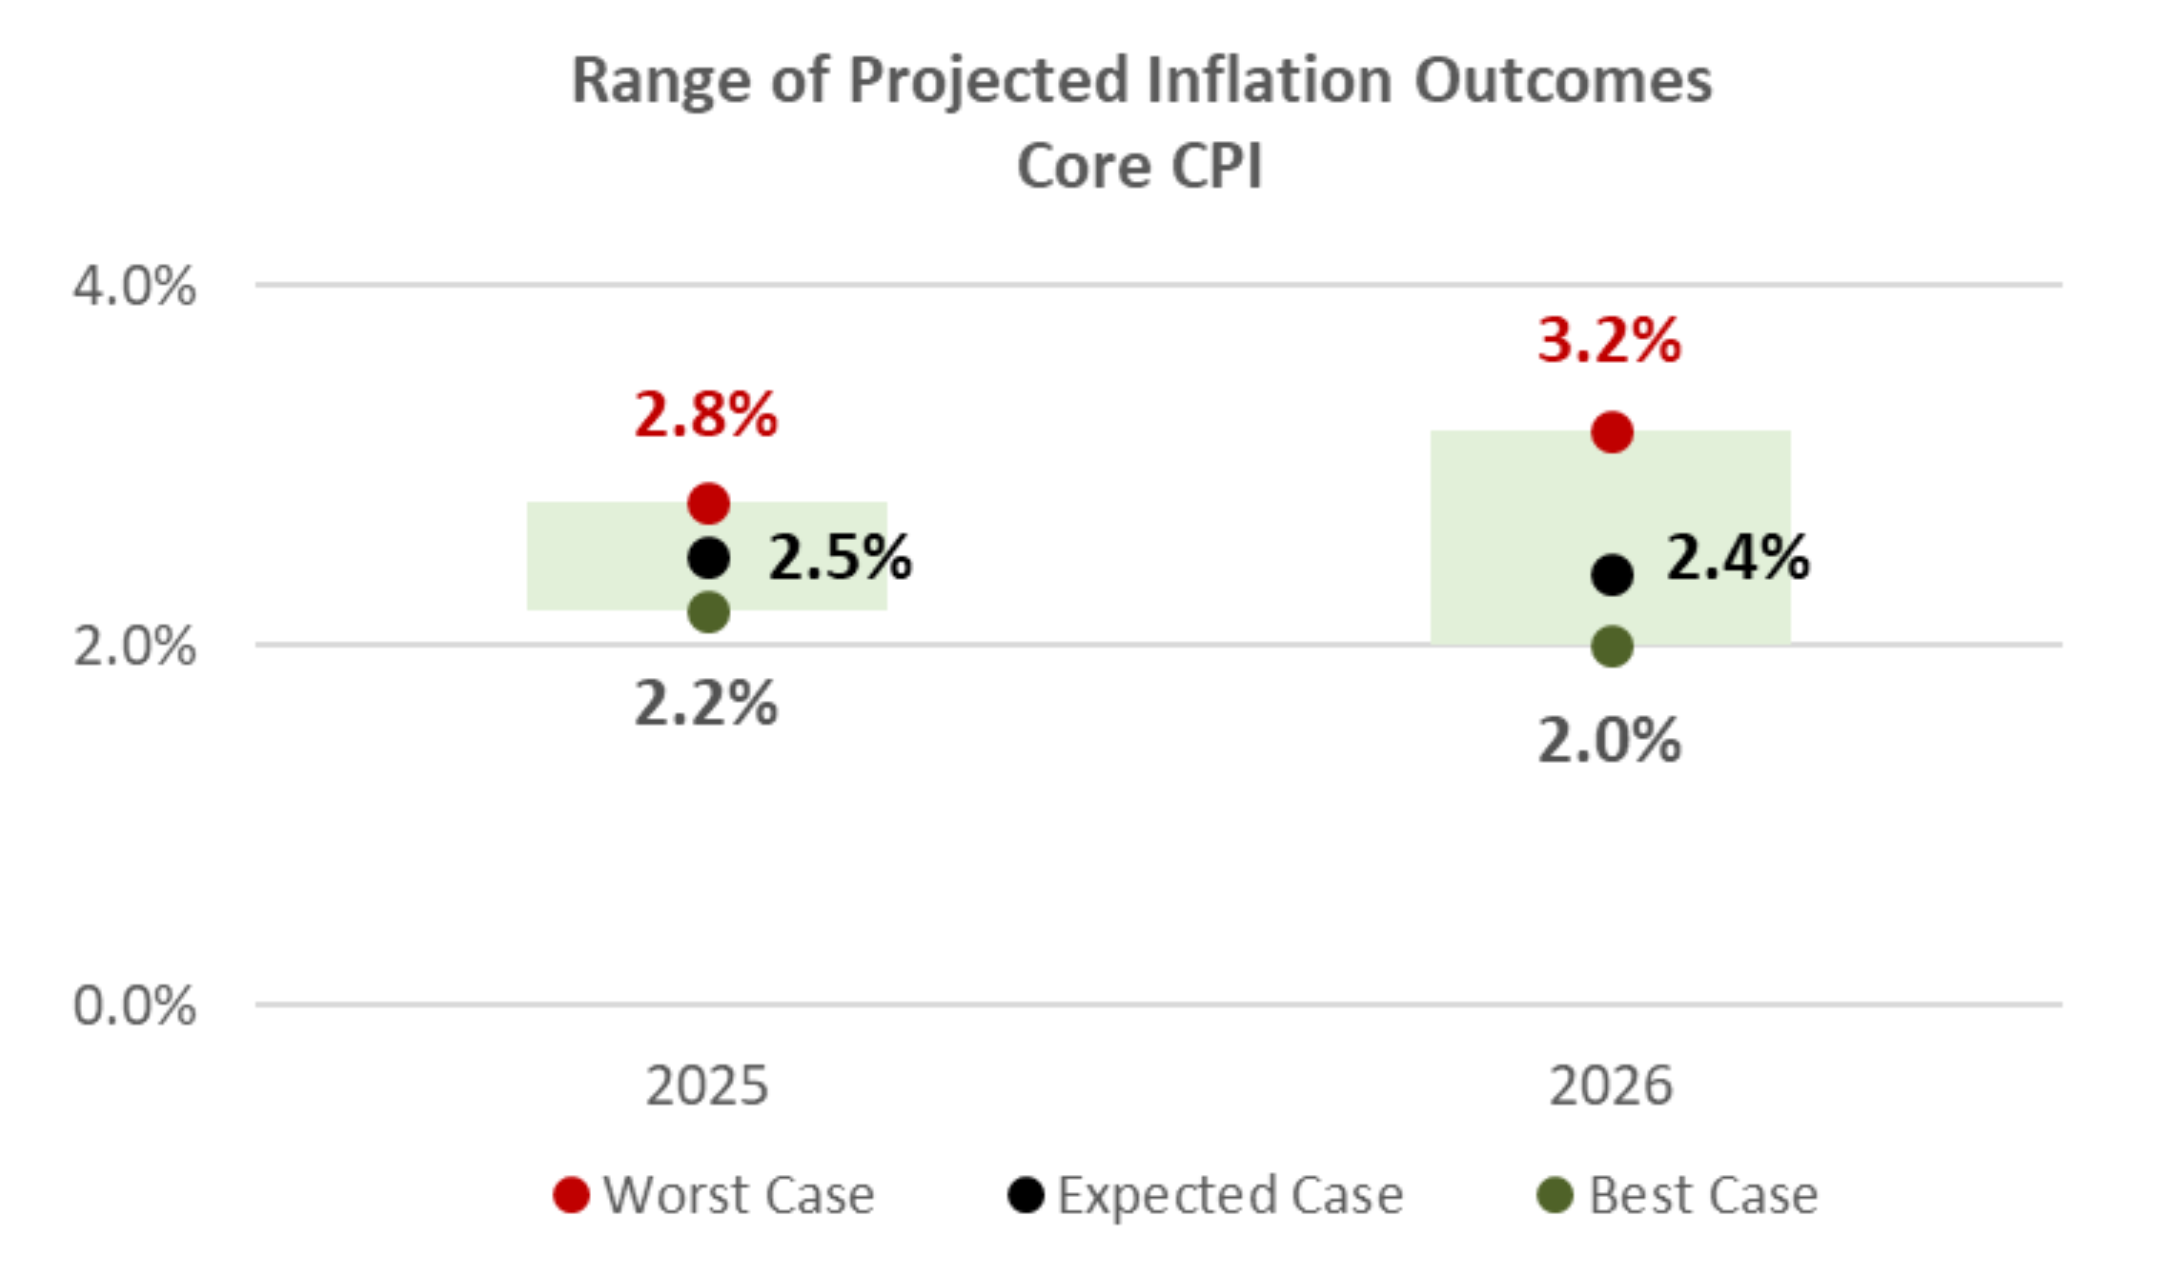
- Inflation is expected to slowly grind lower in 2025, but could remain above the Fed’s 2% target.
- Sticky shelter related inflation coupled with policy changes that may be inflationary in nature (ex: tariffs), may keep inflation stubbornly above the Fed’s inflation target in 2025.
- Assuming a major escalation in trade protectionism does not occur, inflationary impacts from tariffs are expected to be “short term” and “moderate” in nature.
- Scenarios:
- Best Case
- Inflation declines slightly and is close to the Fed’s long-term inflation target before the end of 2025.
- Expected Case
- Inflation continues to moderate slowly and is about 0.5% higher than the Fed’s 2% target by the end of 2025.
- Worst Case
- Inflation continues to be sticky throughout the aggregate economy and remains well above the Fed’s long-term inflation target through the end of 2025.
- Best Case
2025 Expectations: Earnings Growth
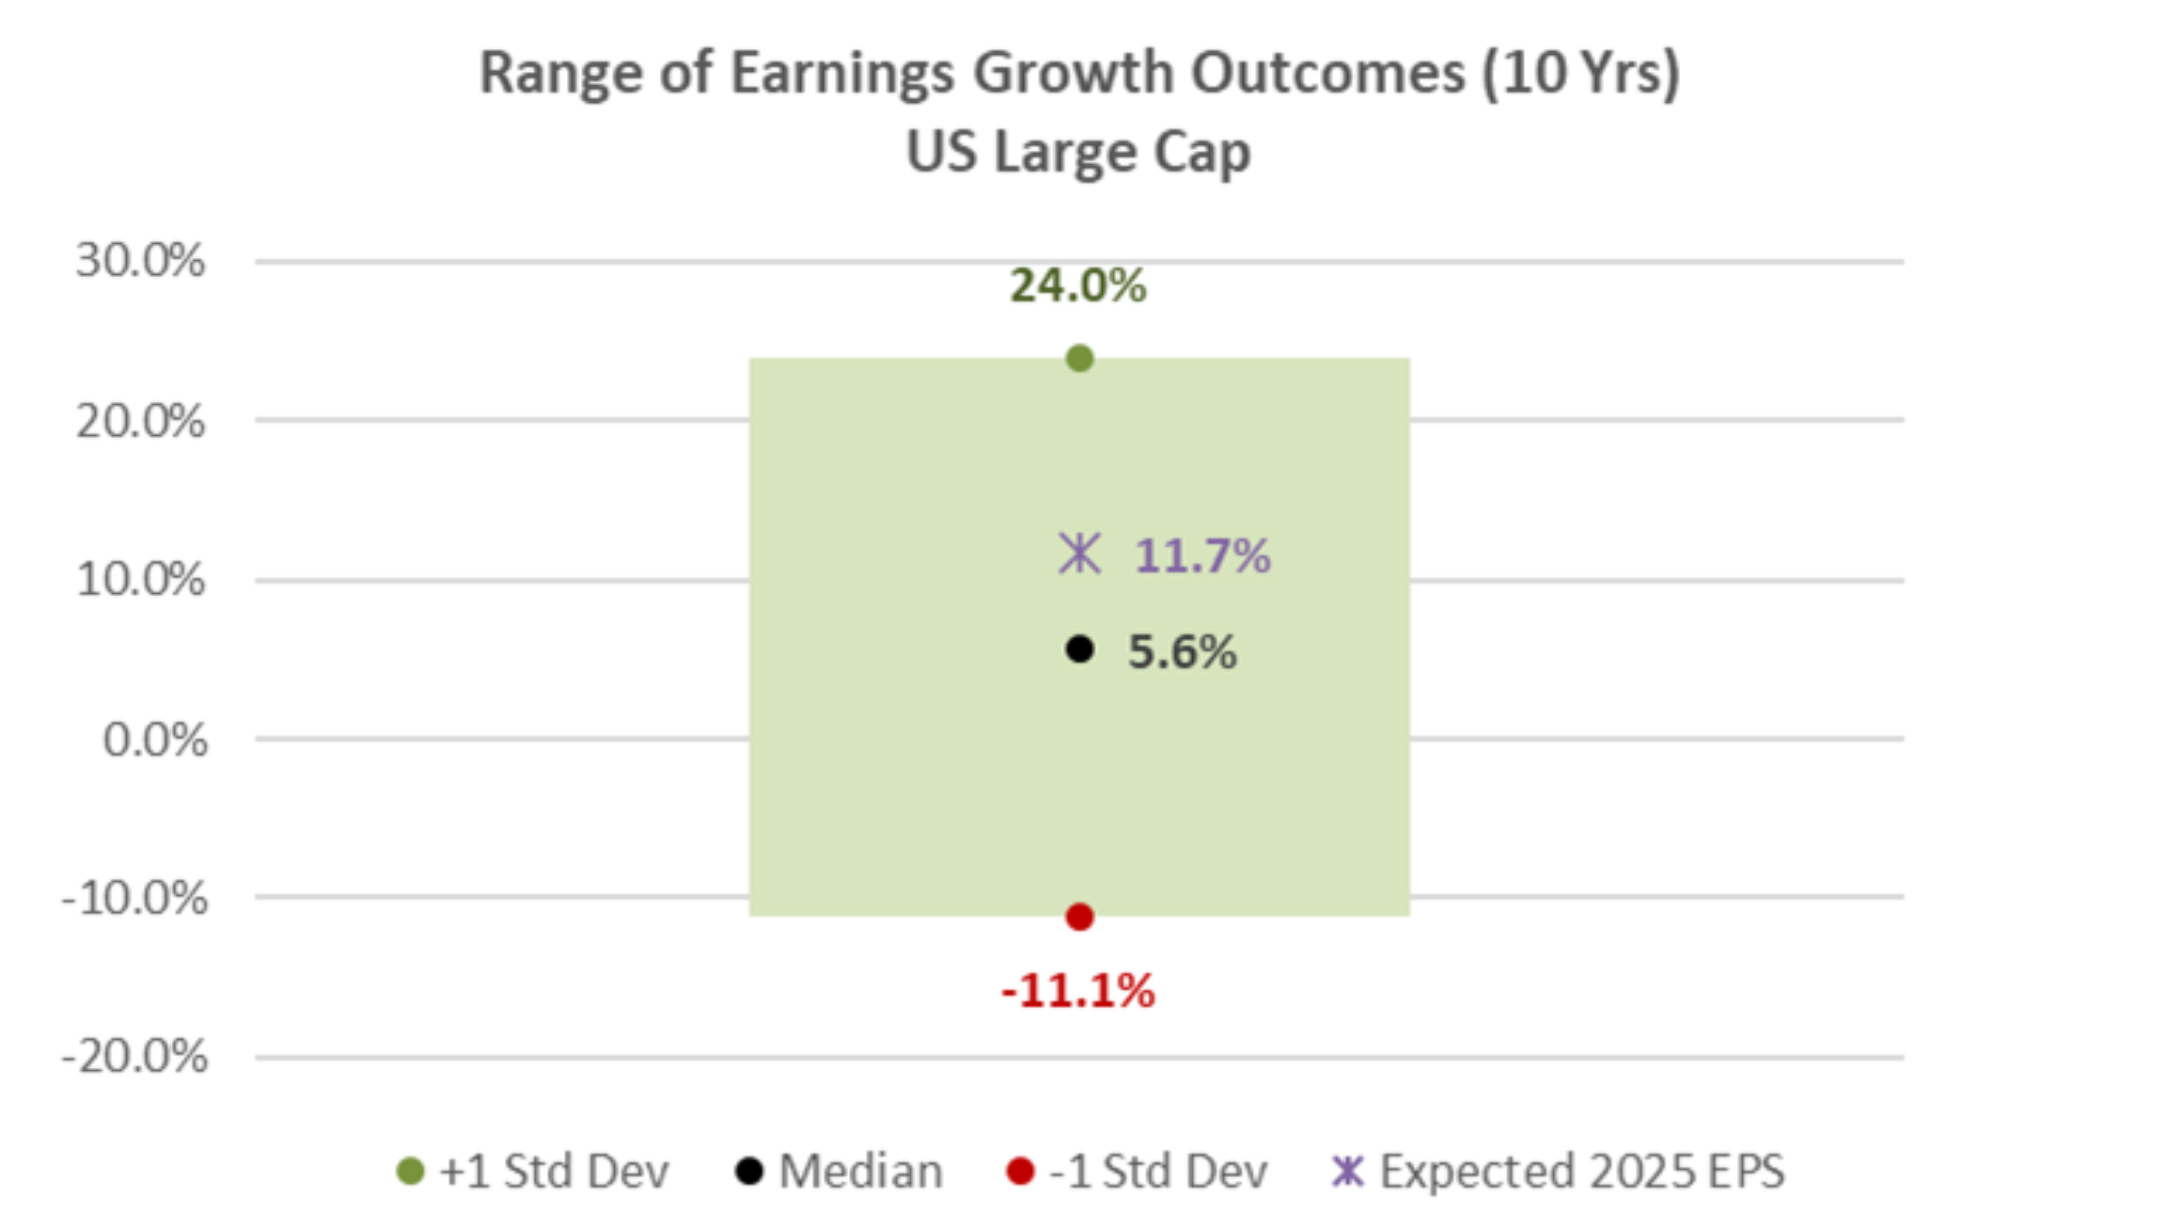
- Earnings growth may improve in 2025, despite expectations for slower consumer spending and slower economic growth.
- Expected earnings growth for U.S. Large Cap stocks (11.7%) is nearly double the median earnings growth recorded over the past 10 years (5.6%).
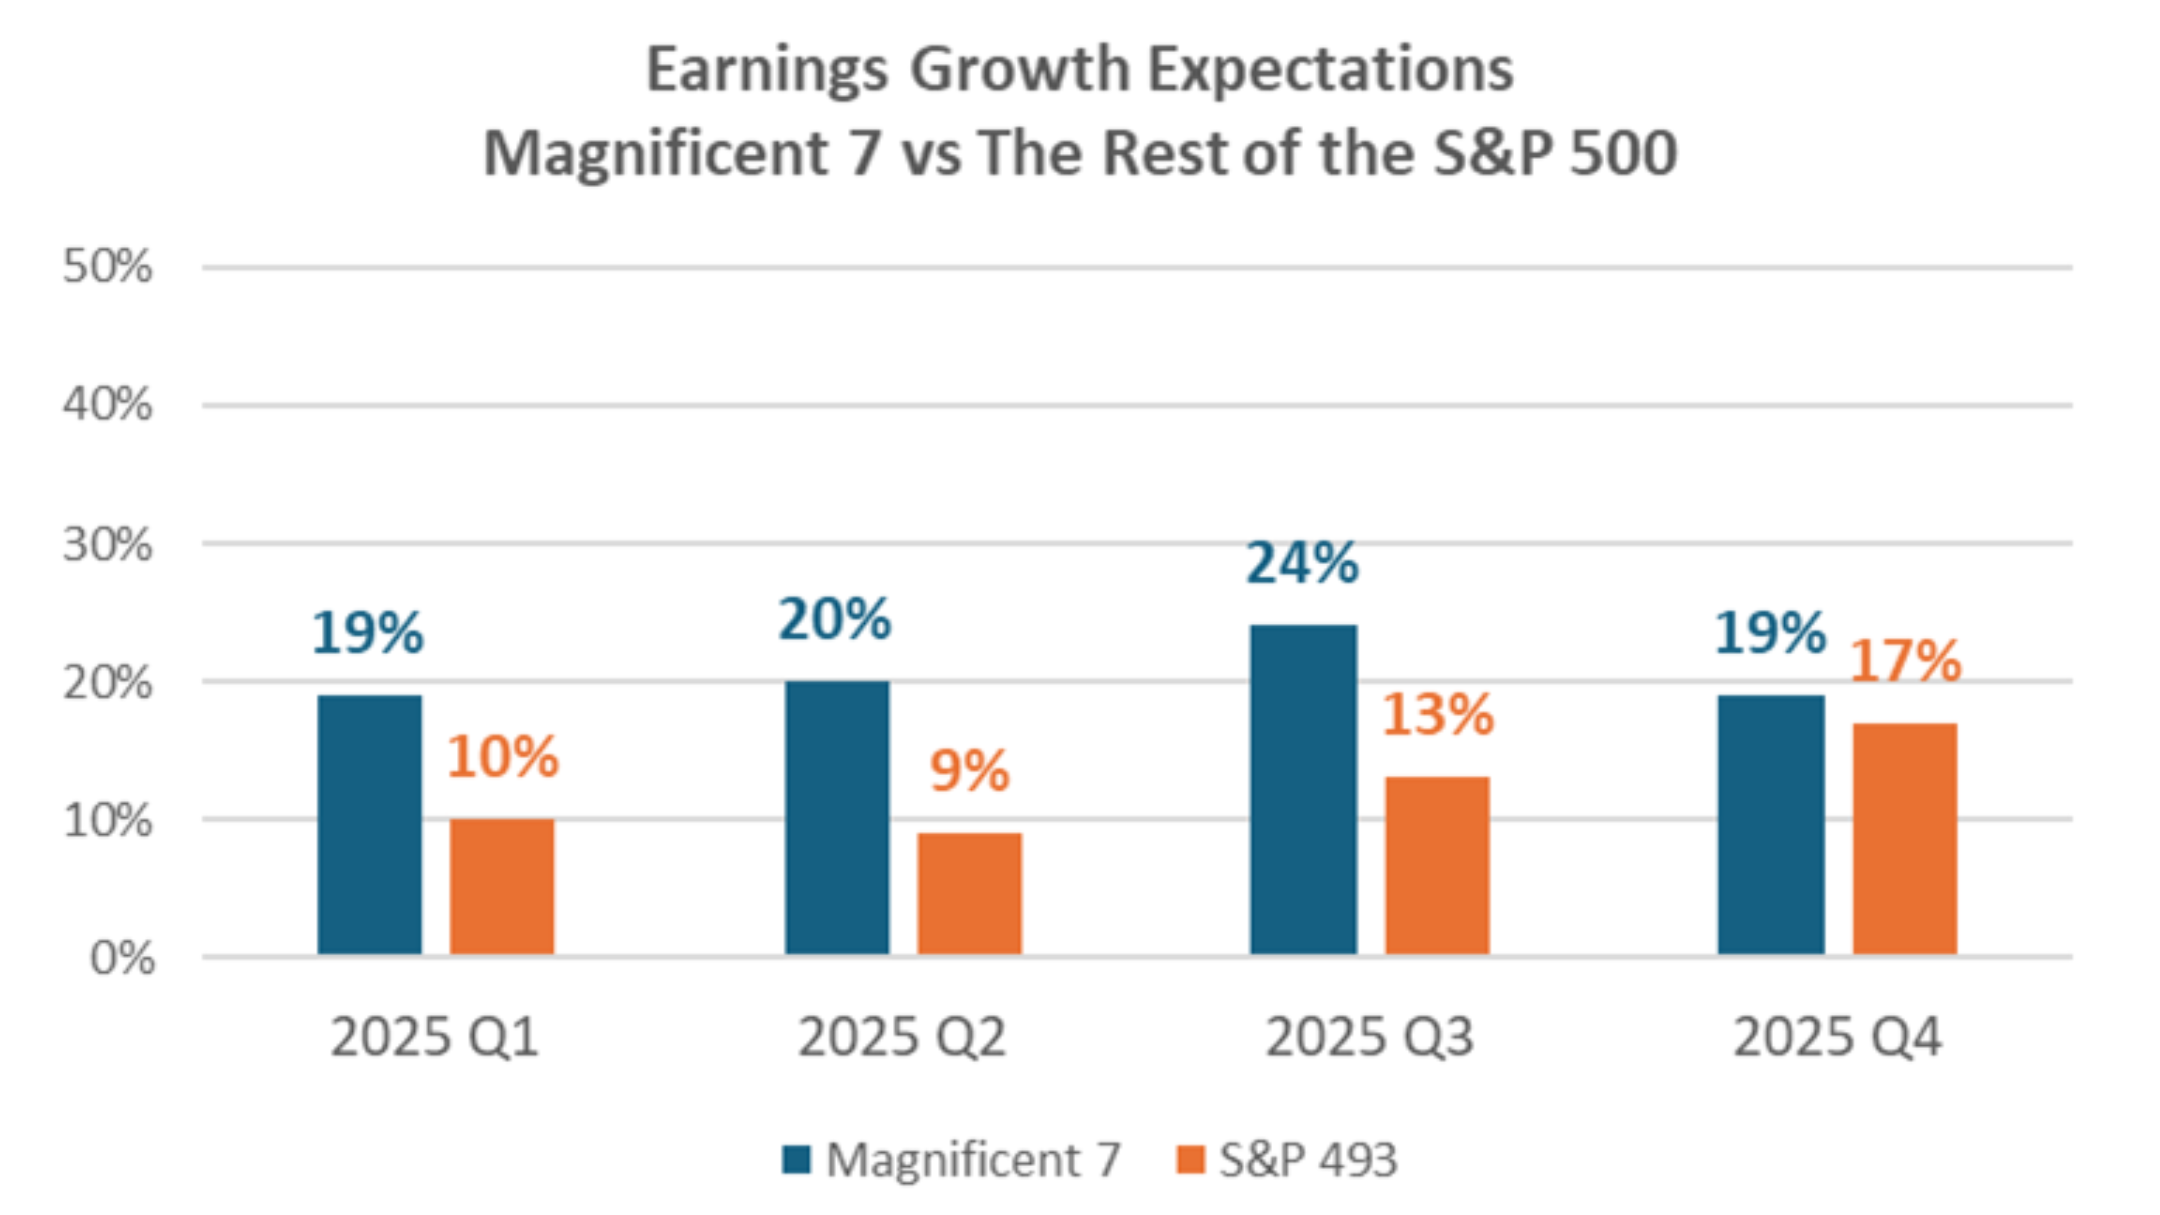
- 2024 Earnings Growth* from Magnificent Seven stocks: 18%
- 2024 Earnings Growth* from the rest of S&P 500: 0%
- Although the Magnificent Seven is expected to have another strong year of earnings in 2025, other equity sectors are expected to contribute significantly more to aggregate earnings than was the case in 2024.
- Takeaways:
- Earnings growth is expected to be broader across the U.S. Large Cap universe.
- Sectors of the U.S. equity market that have meaningfully underperformed Magnificent Seven stocks in recent years may outperform in 2025.
Potential Policy Changes

- The table highlights the impact certain policy changes may have on selected U.S. macroeconomic variables in 2025.
- It is possible to determine the general impact of each policy proposal, but the magnitude of the impacts cannot be predicted until the policies are made final.
- Ex: Tariffs are expected to increase inflation in the U.S., but the magnitude of this increase cannot be predicted until U.S. tariff policies are final.
- It is possible to determine the general impact of each policy proposal, but the magnitude of the impacts cannot be predicted until the policies are made final.
- Certain proposed policies may change more meaningfully than others prior to implementation.
- Ex: While extending the 2017 tax reform looks highly probable in its current form, current immigration reform proposals are likely to change meaningfully prior to implementation.
- Certain policy changes are expected to have shorter-term impacts on the macroeconomy than others.
- Ex: The impact of tariffs and tax reform are likely to be felt over a very short time frame (several quarters), while the impact of immigration reform could be felt for a longer period of time (several years).
- Takeaways:
- Current policy proposals are not “definite” yet and are far from certain.
- In aggregate, the proposed policy changes in the U.S. are expected to be slightly pro-growth and slightly inflationary.
- Many of the proposed policies may have short term impacts and are unlikely to change the long-term trajectory of U.S. economic growth in a meaningful way.
Potential Policy Changes: Corporate Income Tax Reform
- U.S. corporate income tax reform could help boost corporate earnings over the short term, but the impact of the proposed tax cuts would be rather limited compared to the tax cuts enacted in 2018 when corporate income tax rates were cut from 35% to 21%.
- Current proposed changes to corporate income tax code includes lowering income tax rates from 21% to 15%, but the benefit may only apply to firms that produce goods in the U.S.
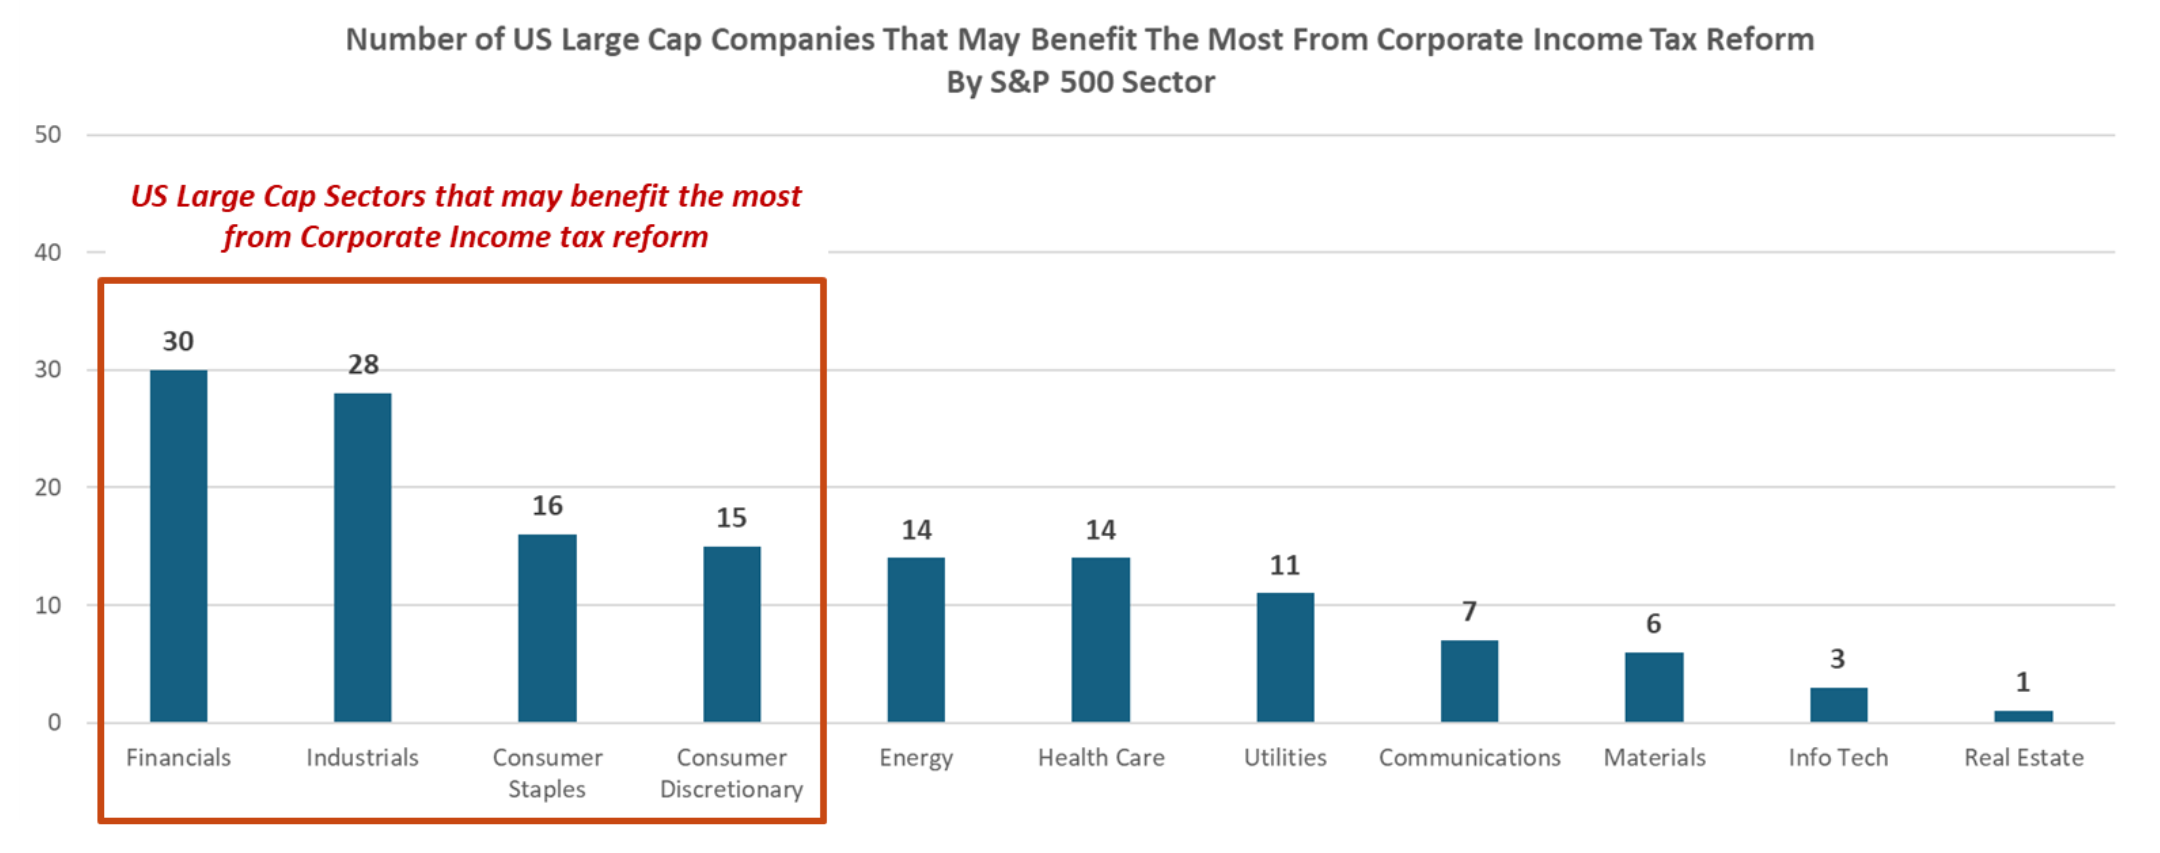
- Firms that pay higher effective income tax rates (ex: above 15%) and produce more than 80% of annual revenue in the U.S. stand to benefit the most. Firms that generate more revenue overseas (or already have low effective tax rates) may not benefit.
- Takeaway:
- Firms within Financials, Industrials, Consumer Staples and Consumer Discretionary may benefit the most from corporate income tax reform.
2025 Potential Policy Changes: Tariffs and Trade Protectionism

- An escalating trade war is not “good” for any U.S. equity sector, but certain sectors are less exposed to trade protectionism than others.
- U.S. equity sectors that have a relatively high percentage of revenue generated domestically are less impacted by trade war escalation.
- U.S. equity sectors that have a relatively high percentage of revenue generated overseas are more impacted by trade war escalation.
- Takeaways:
- Financial, real estate and utility sectors will be impacted the least, should trade protectionism escalate.
- Info tech, materials, and communications sectors have the most to lose, should trade protectionism escalate.
Potential Policy Changes: Immigration Reform
- Immigration reform could have a material impact on the U.S. labor market.
- There are more than 8 million undocumented workers in the U.S.
- Mass deportation of undocumented workers could reduce the U.S. workforce by as much as 5%.
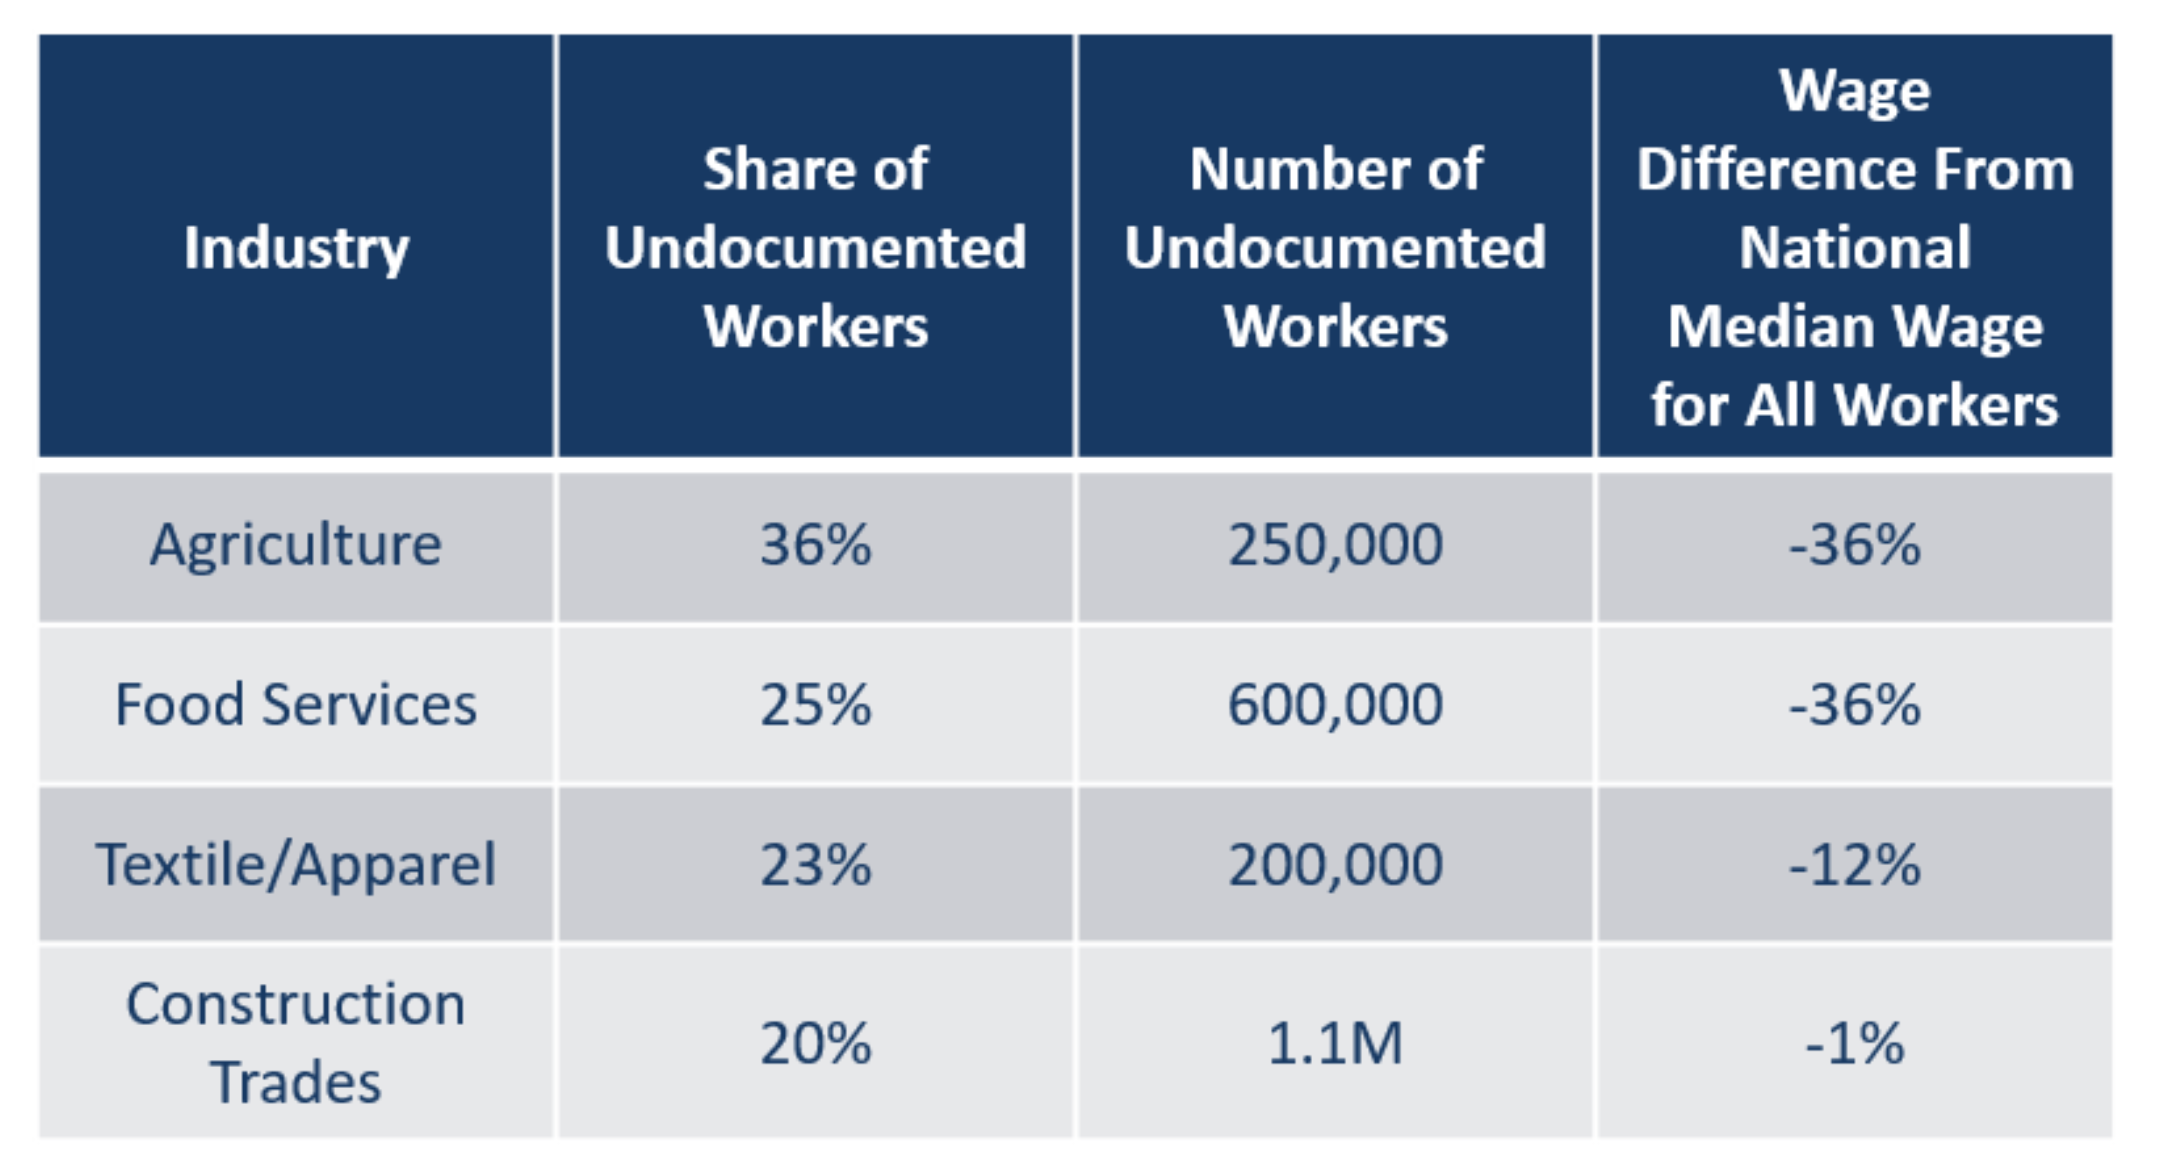
- The table on the right illustrates the industries that could be most impacted through immigration reform.
- Immigration reform could meaningfully impact industries that have a high share of immigrant employees.
- Takeaway:
- Although immigration reform has the potential to impact selected industries in a material way, it is likely that current immigration reform proposals will be watered down prior to implementation.
Equity Valuations
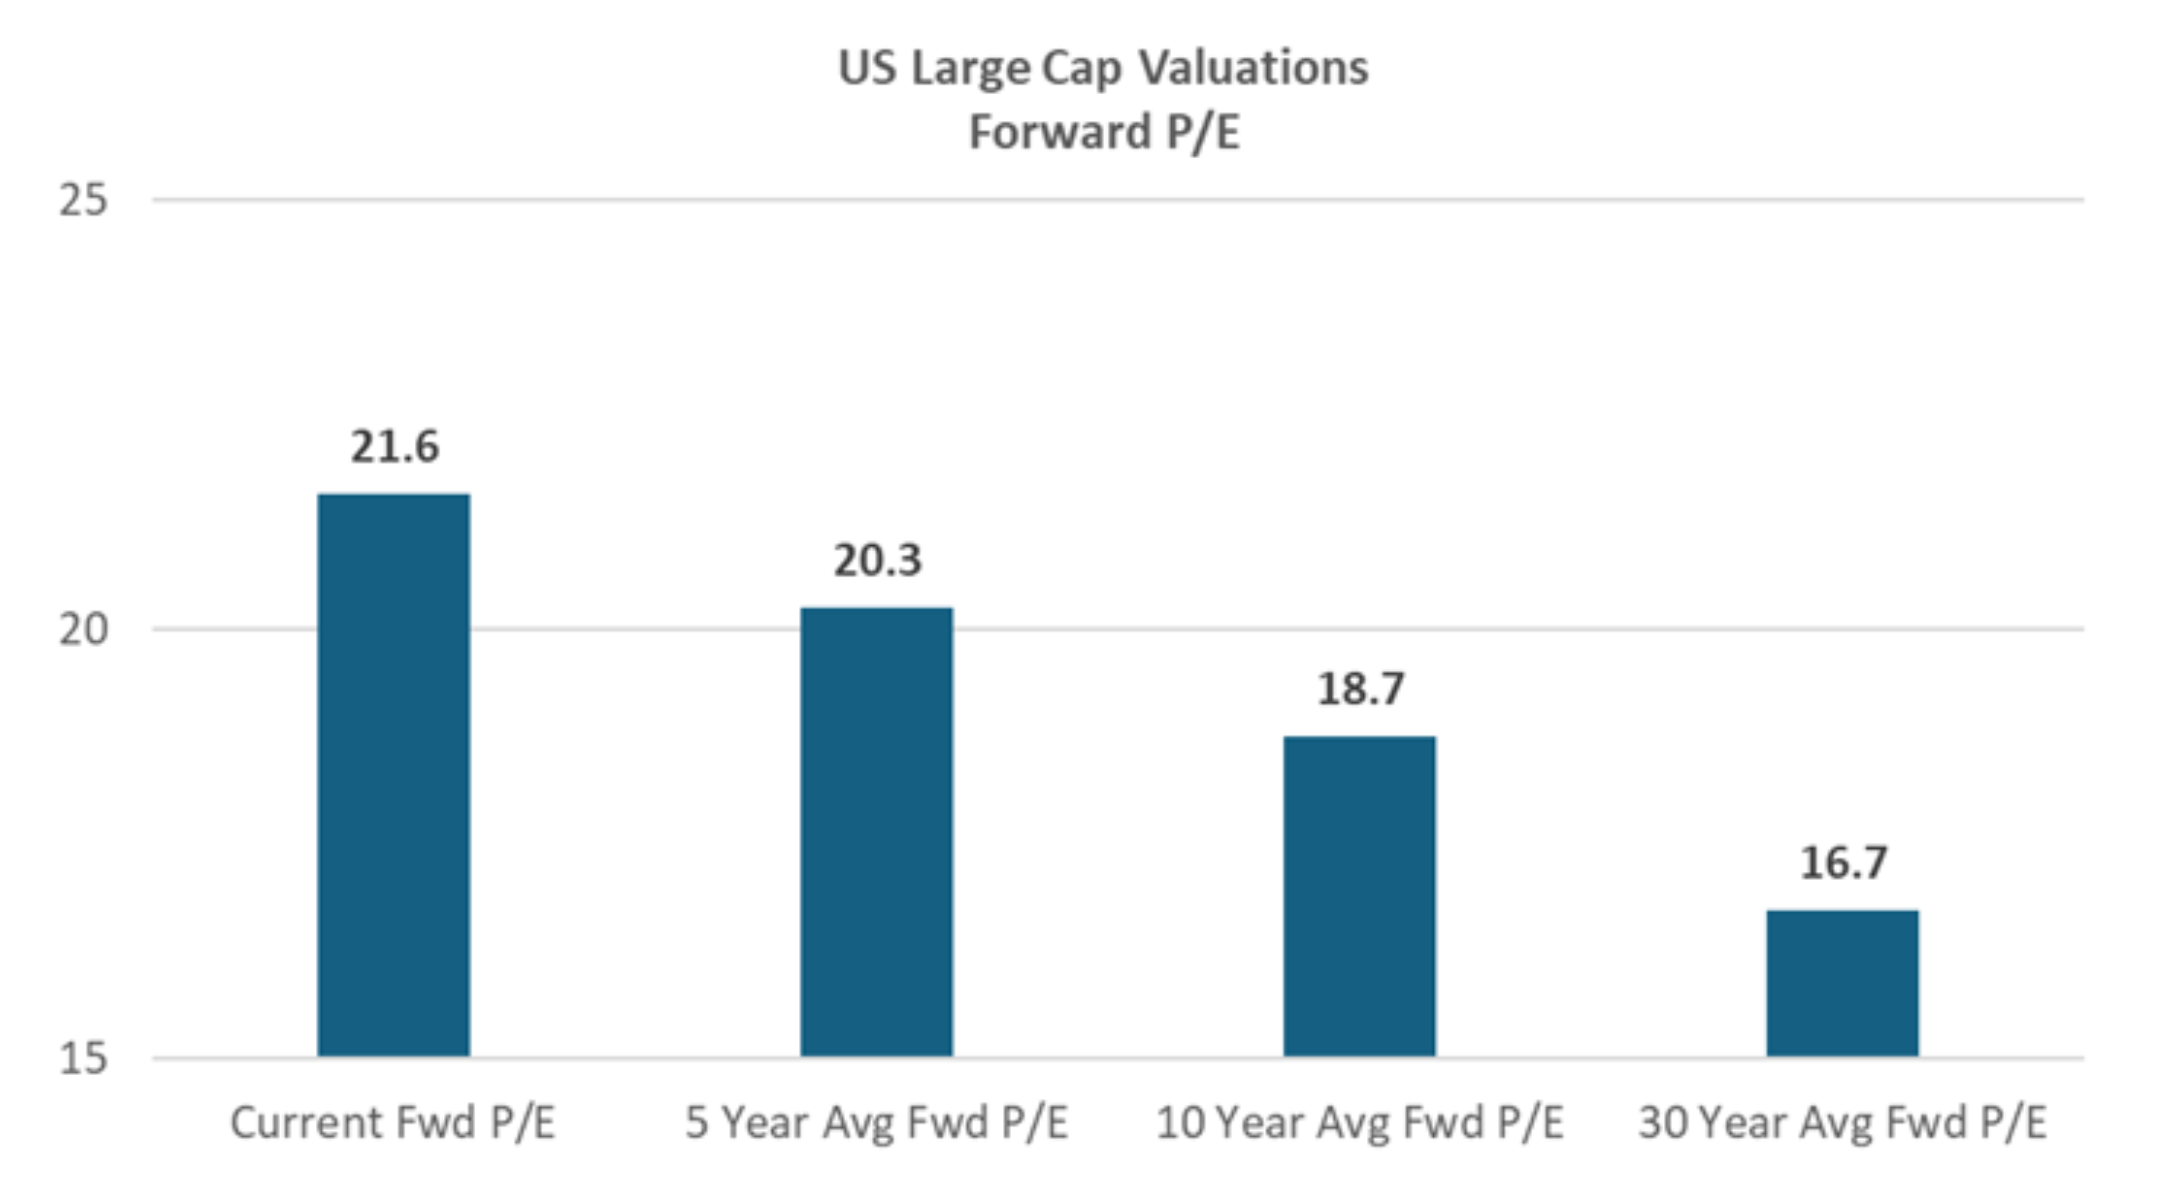
- U.S. Large Cap equity valuations are “expensive” compared to historical norms.
- Ex: U.S. Large Cap Forward price-to-earnings ratio (P/E) is currently 21.6, which is 30% higher than the long-term (30 year) average Forward P/E.
- Other fundamental valuation metrics (Forward price-to-book (P/B), Forward price-to-sales (P/S), etc.) also indicate that U.S. Large Cap stocks are “expensive” compared to historical observations.
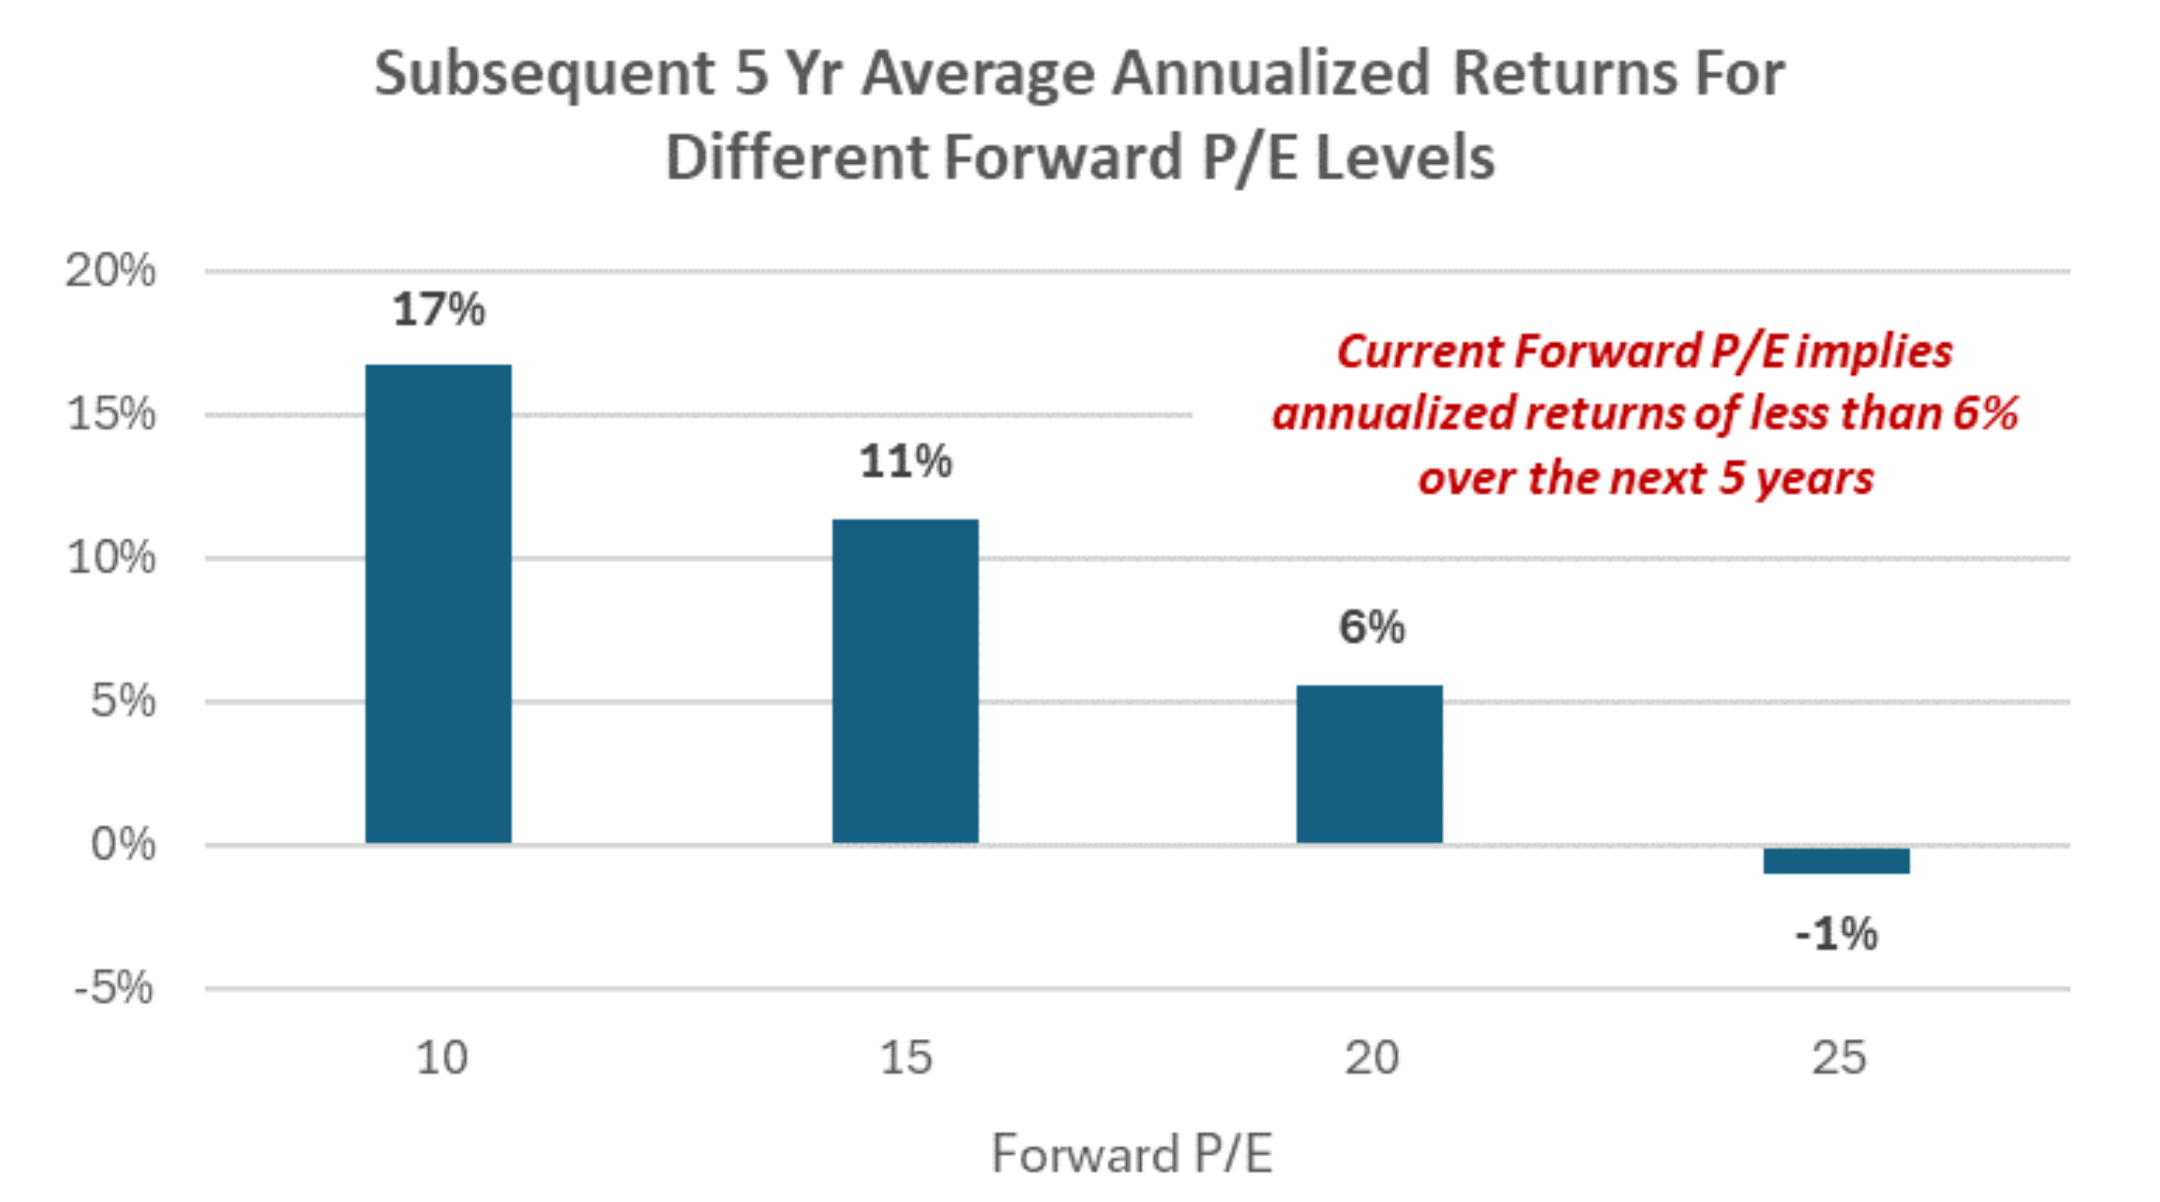
- Higher than average equity valuations have historically led to lower equity returns in subsequent years.
- When U.S. Large Cap stocks are “very cheap”, annualized returns in the following five years have averaged 17%.
- When U.S. Large Cap stocks are “very expensive”, annualized returns in the following five years have averaged -1%.
- Takeaways:
- Investors should be mindful of the fact that high valuations historically have led to lower future returns.
- U.S. Large Cap stocks may underperform lower valuation asset classes (ex: U.S. Small Cap) as long as the U.S. economy continues to grow.
Relative Valuations: US Large Cap Comparison
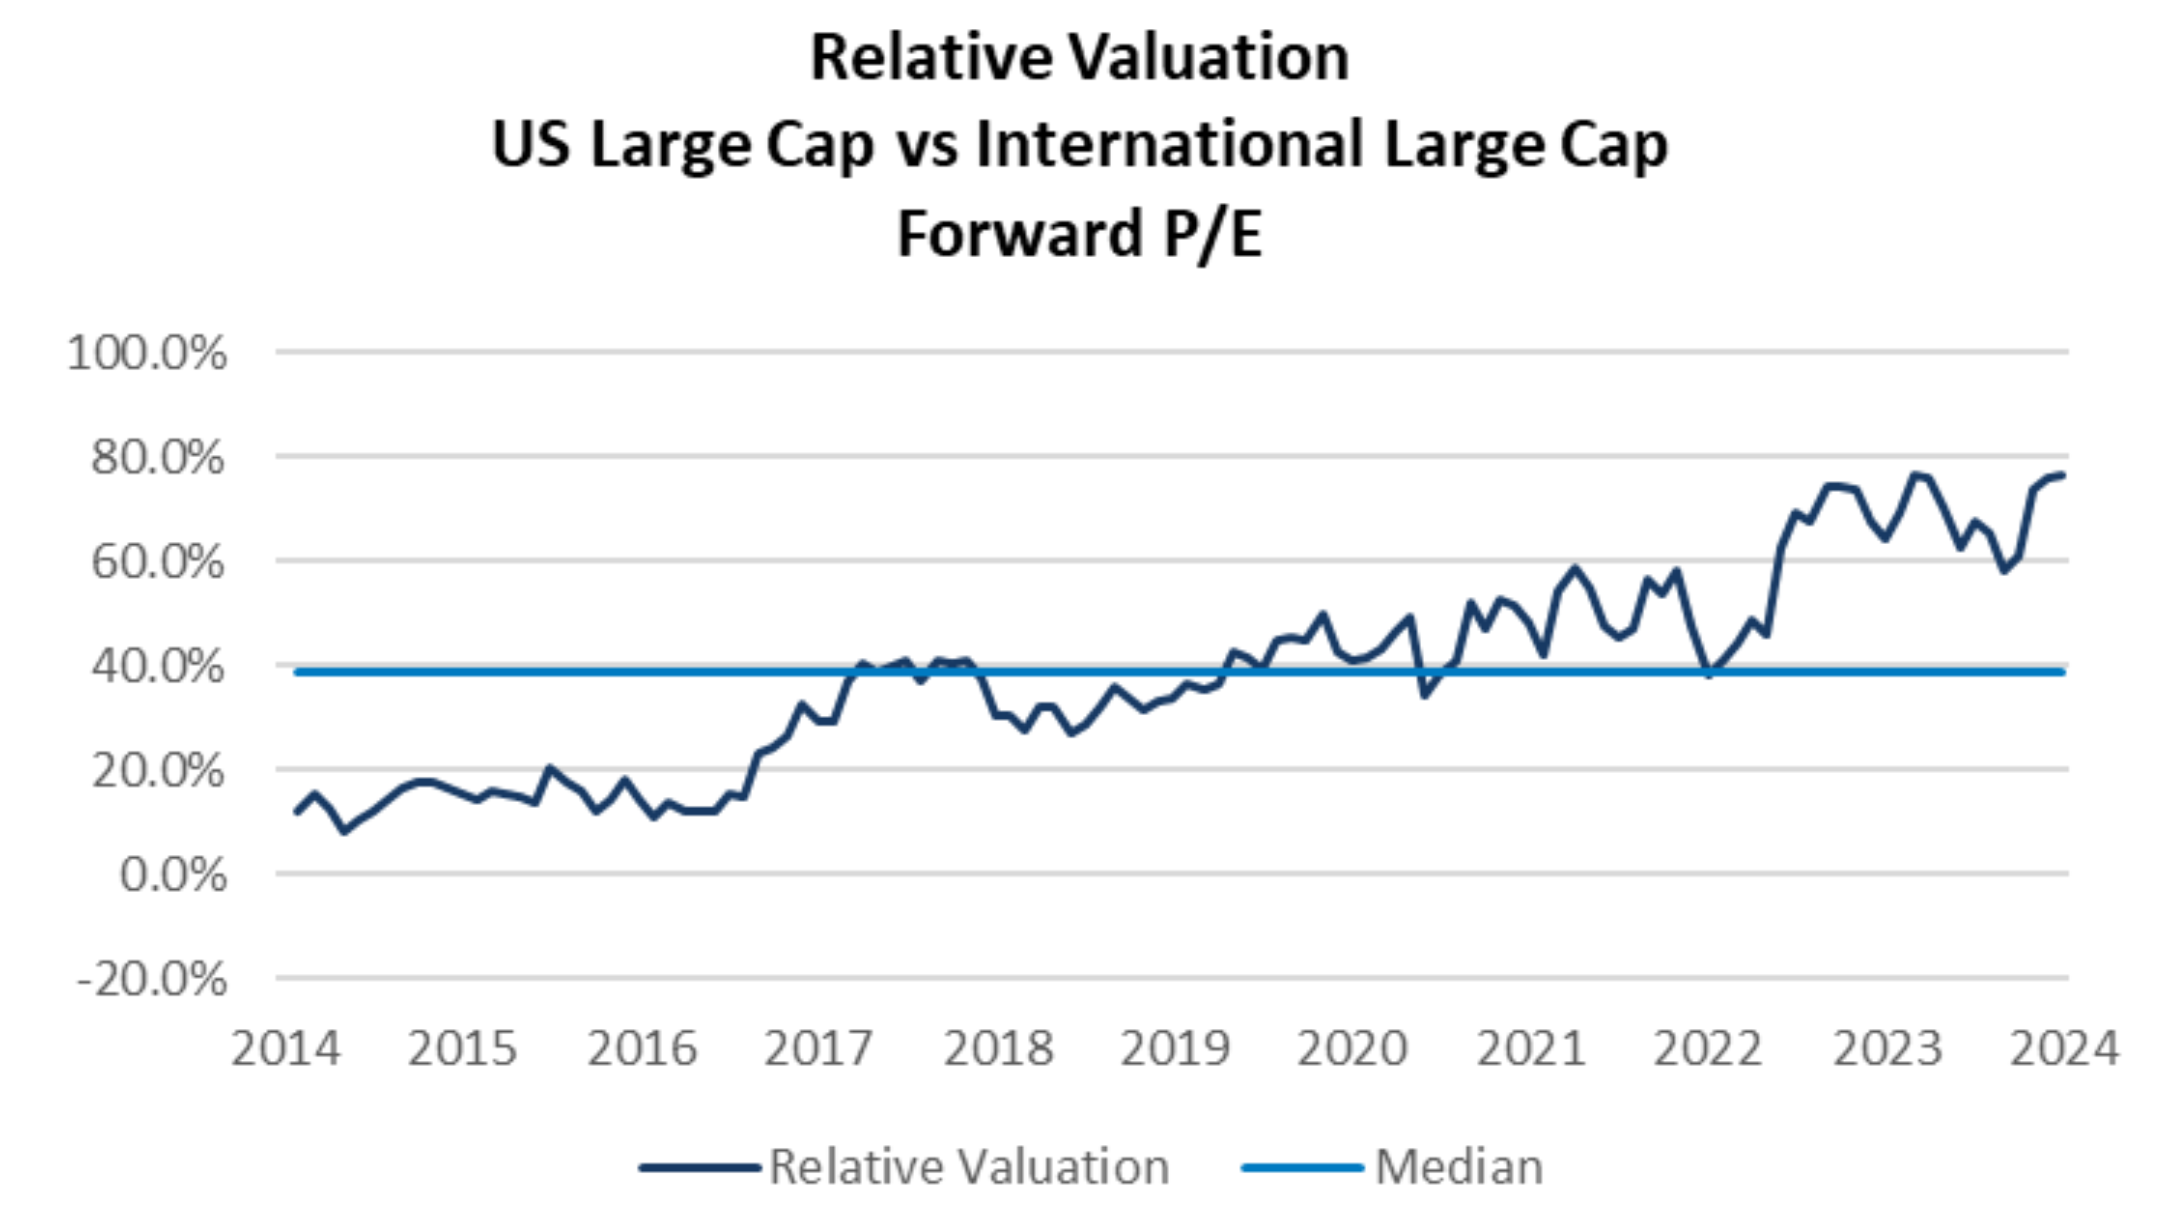
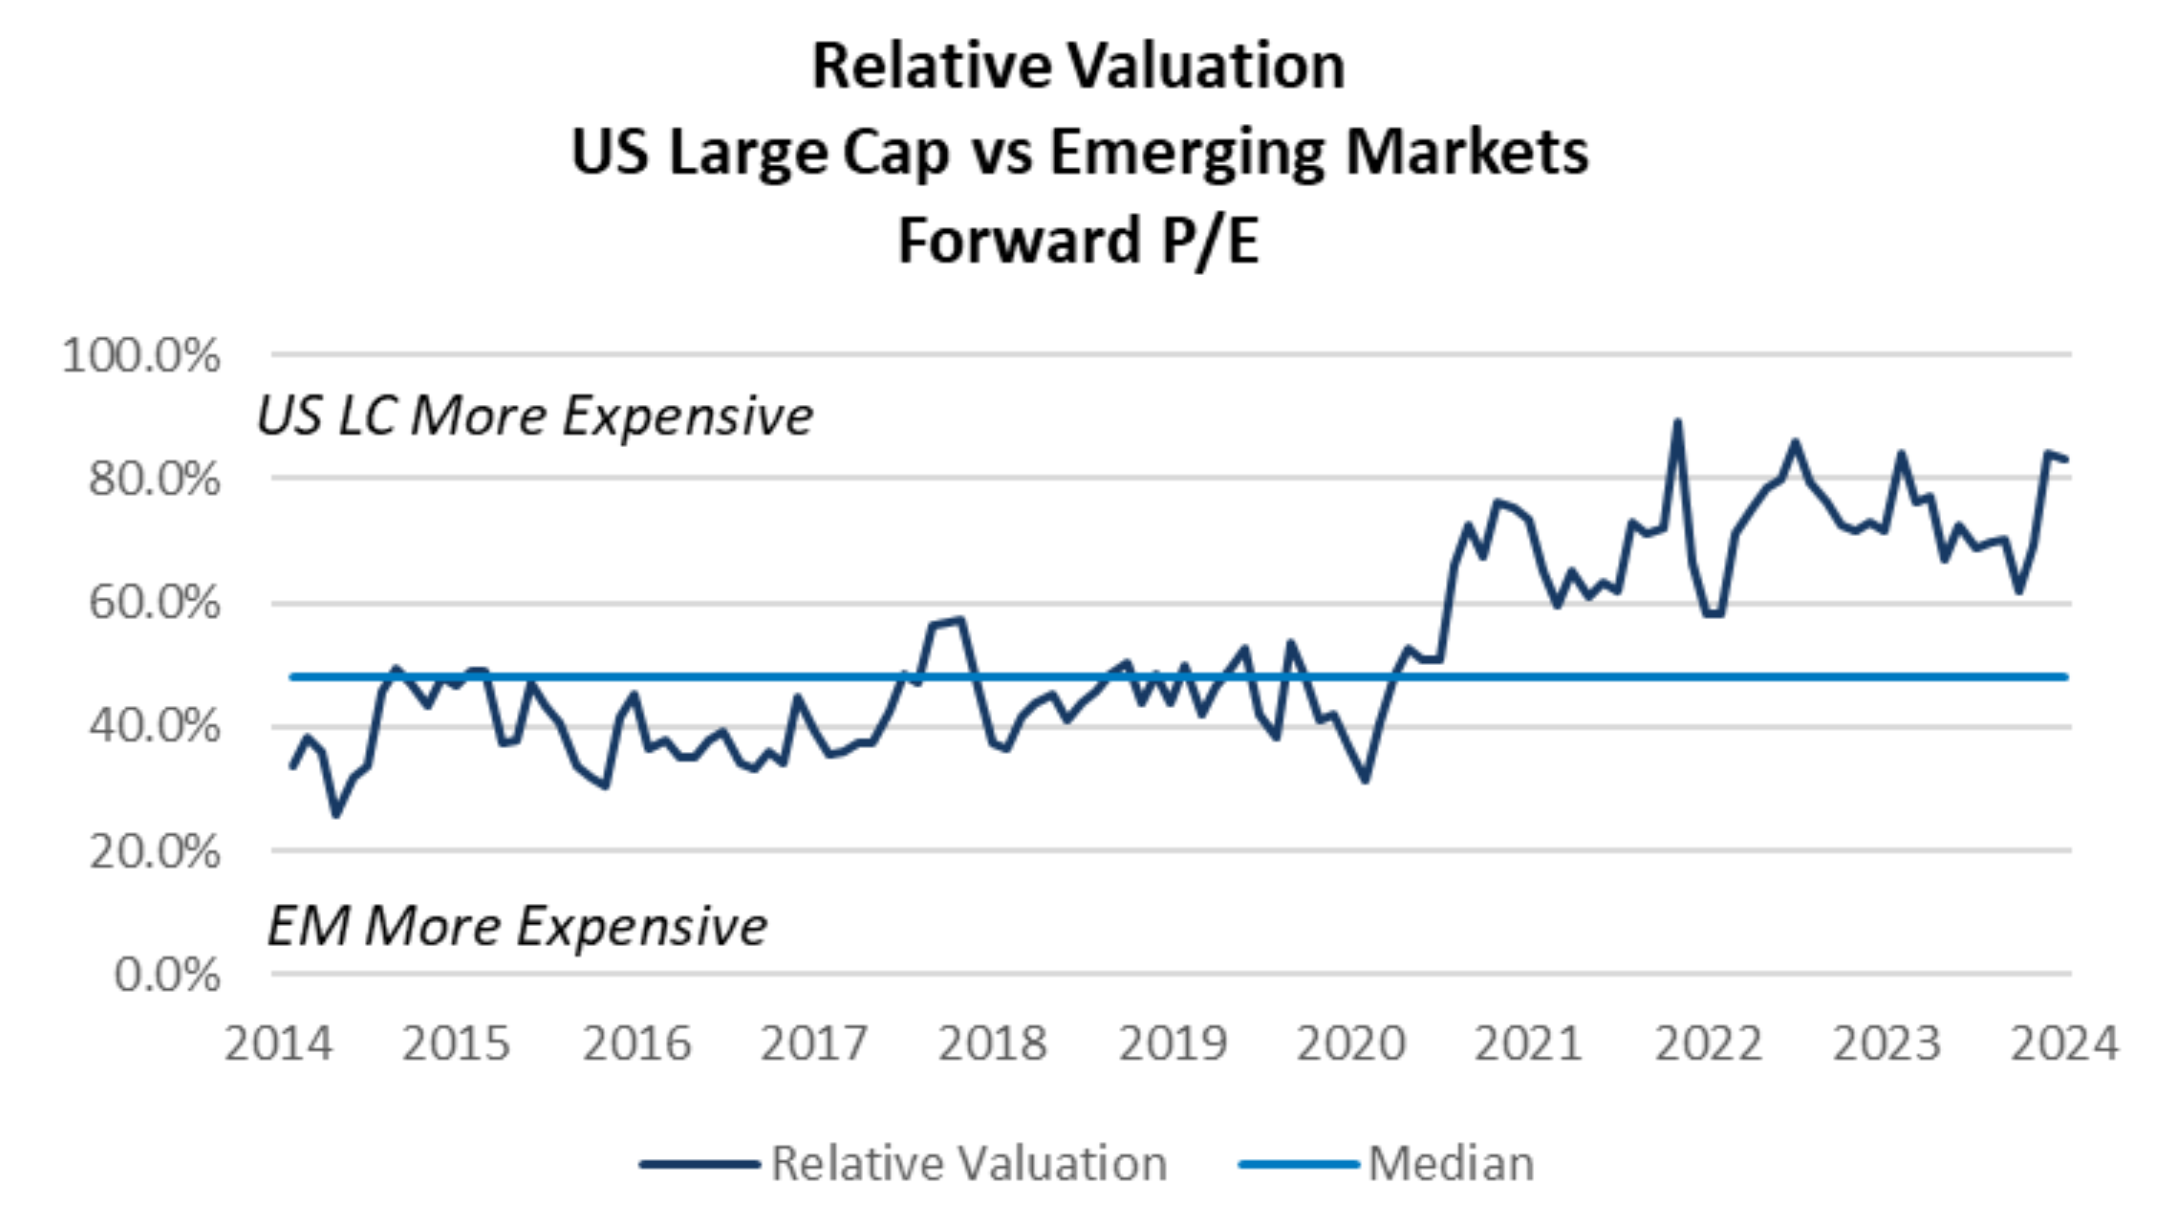
- Fundamental valuation metrics suggest that U.S. equities are “expensive” on a relative basis.
- Relative valuations for U.S. Large Cap stocks are near 10- year highs.
- Economic considerations:
- Although International and Emerging Market equities are attractive from a fundamental valuation perspective, the two asset classes have much more downside exposure to tariffs and trade wars than U.S. stocks.
- Takeaway:
- An underweight to International Equity and Emerging Market equity is recommended given the potential for trade related volatility in 2025.
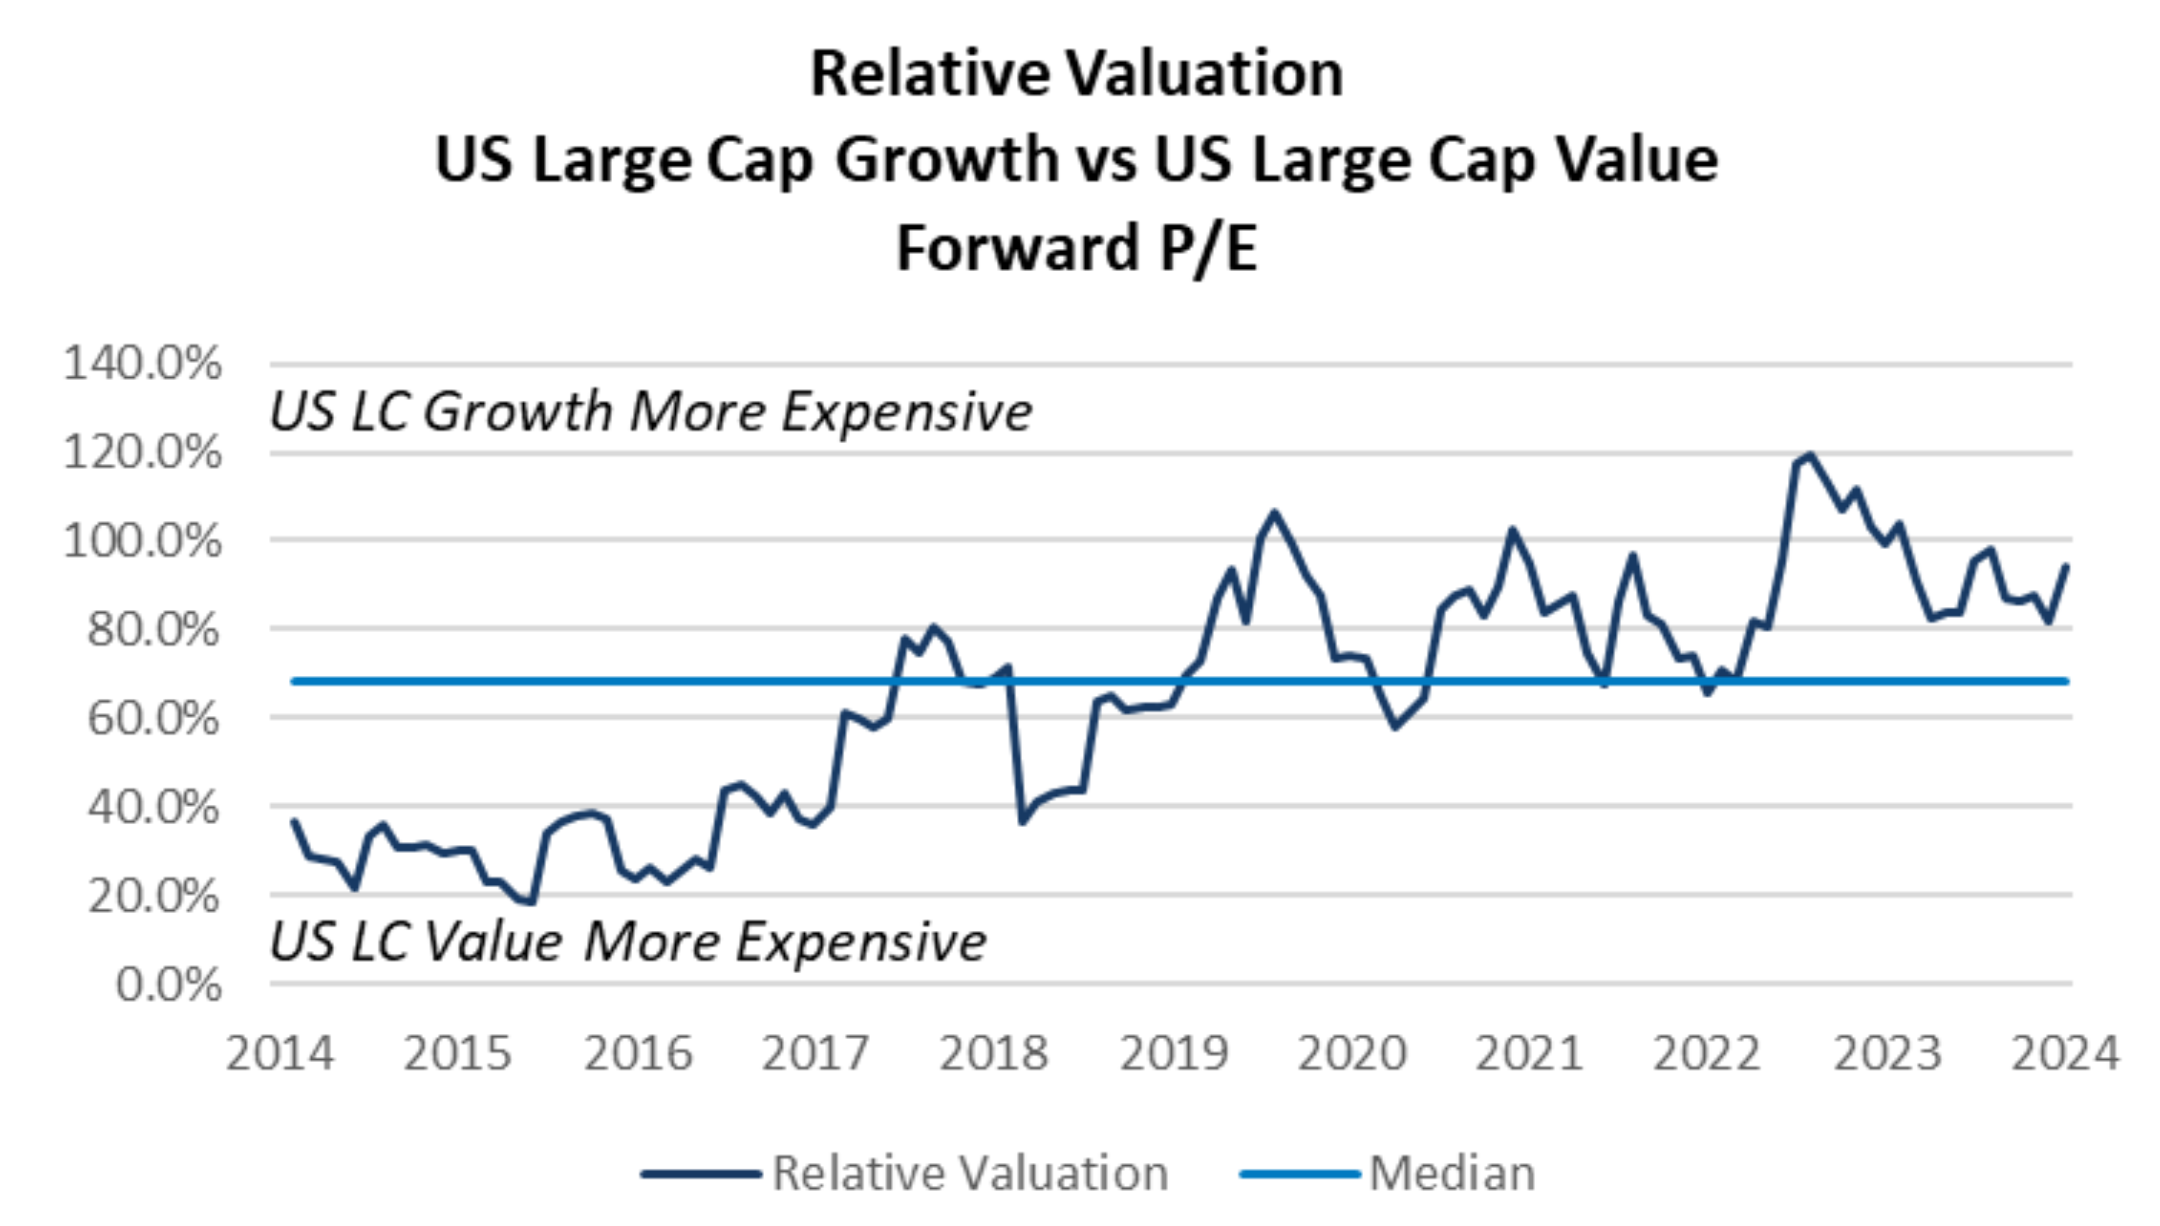
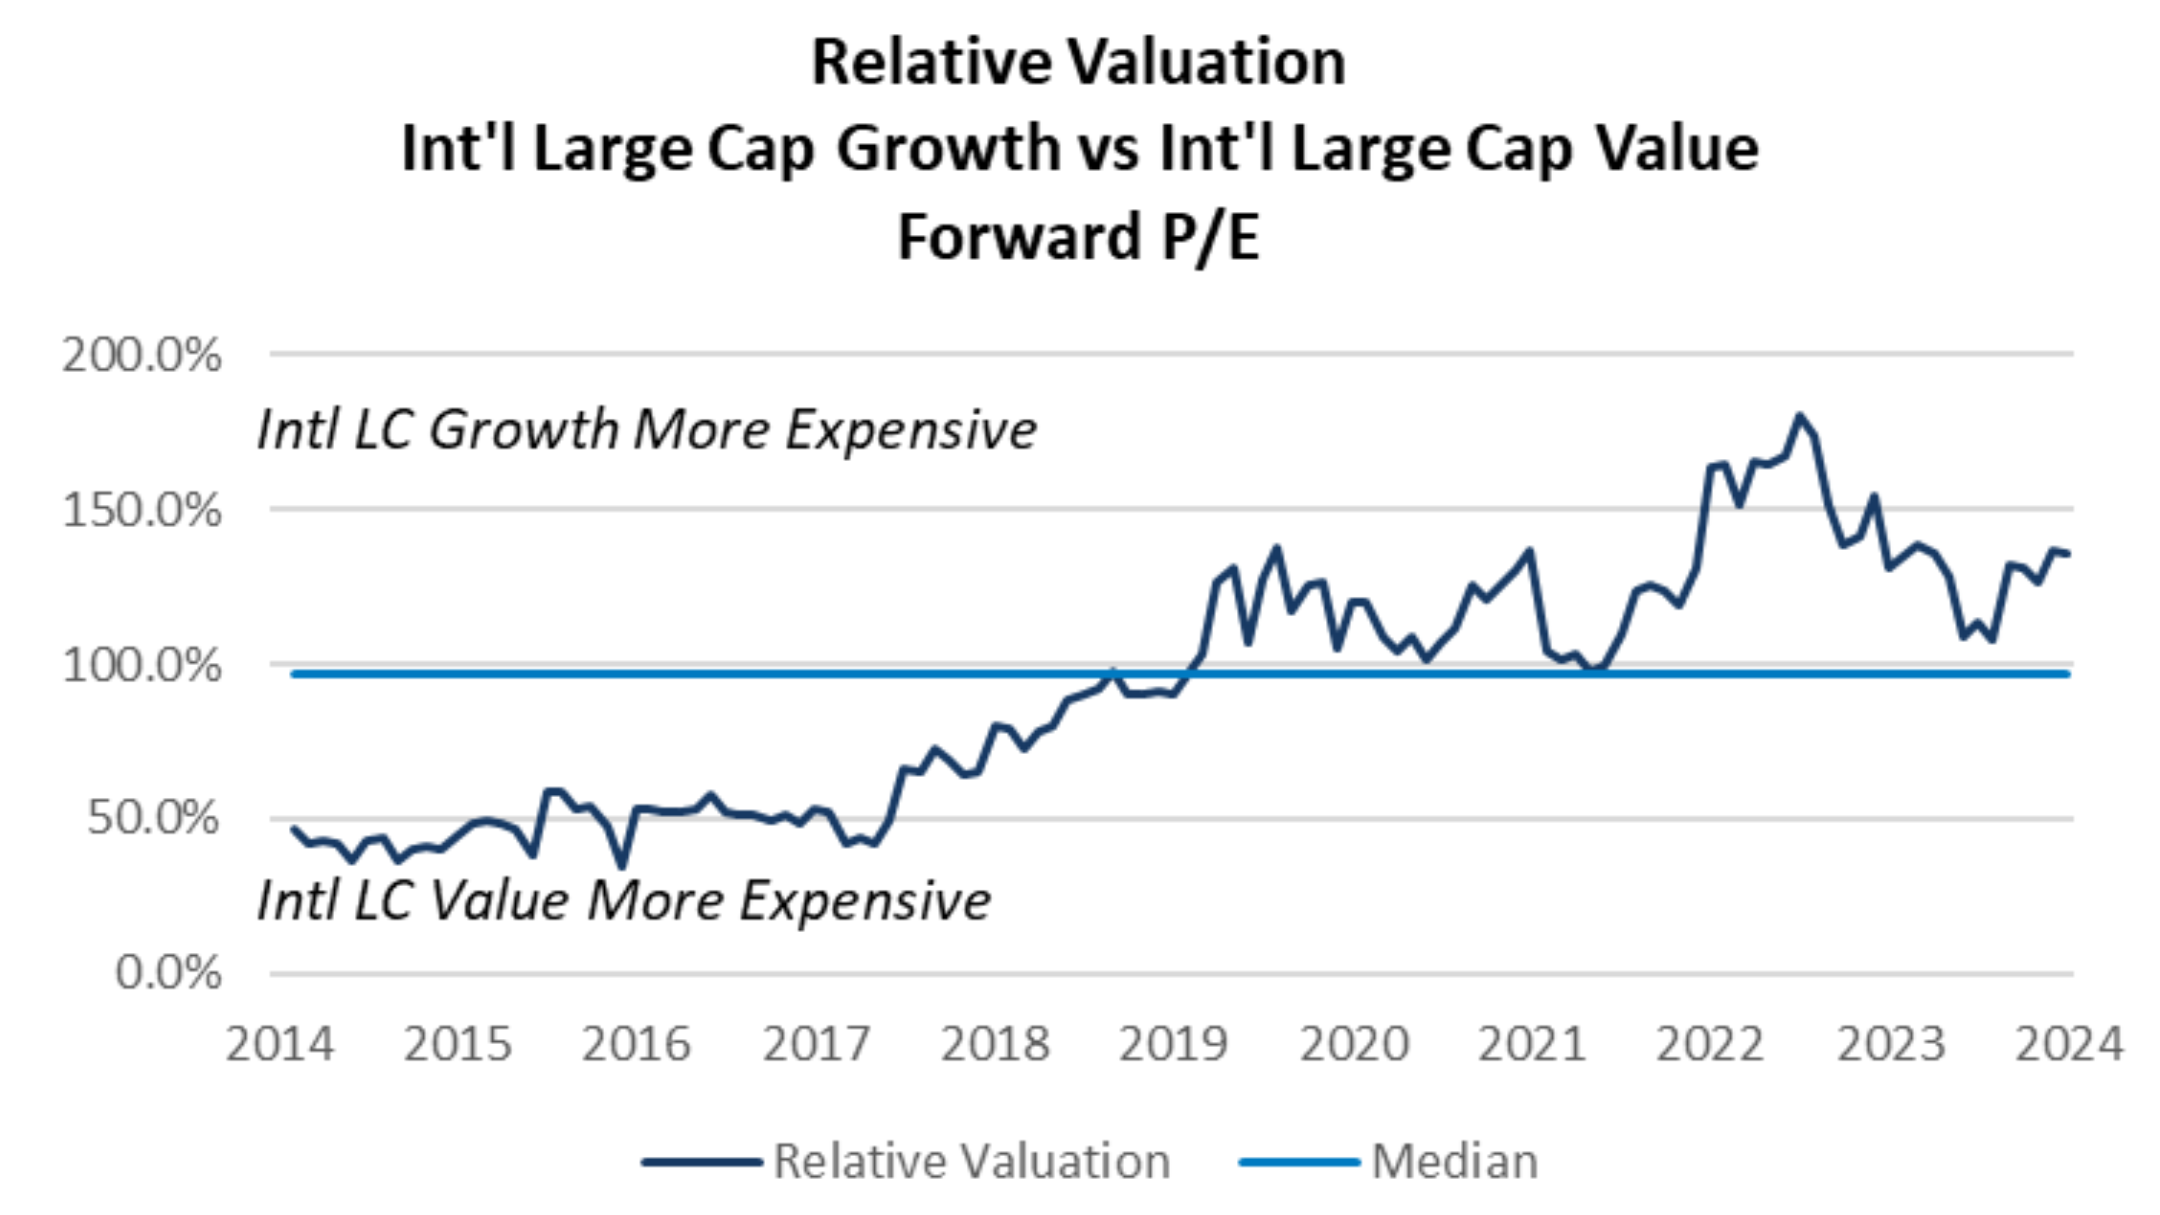
Relative Valuations: Growth vs Value Comparison
- Fundamental valuation metrics suggest that “Growth” equities are still more expensive than “Value” equities.
- Economic considerations:
- “Value” equities carry less risk than “Growth” equities and have less downside exposure should market volatility increase.
- Value stocks also have less downside exposure to trade and tariff related volatility than Growth stocks.
- Takeaway:
- An overweight to “Growth” relative to “Value” is not recommended given current fundamental valuations and the potential for trade related volatility.
Fixed Income: Treasuries
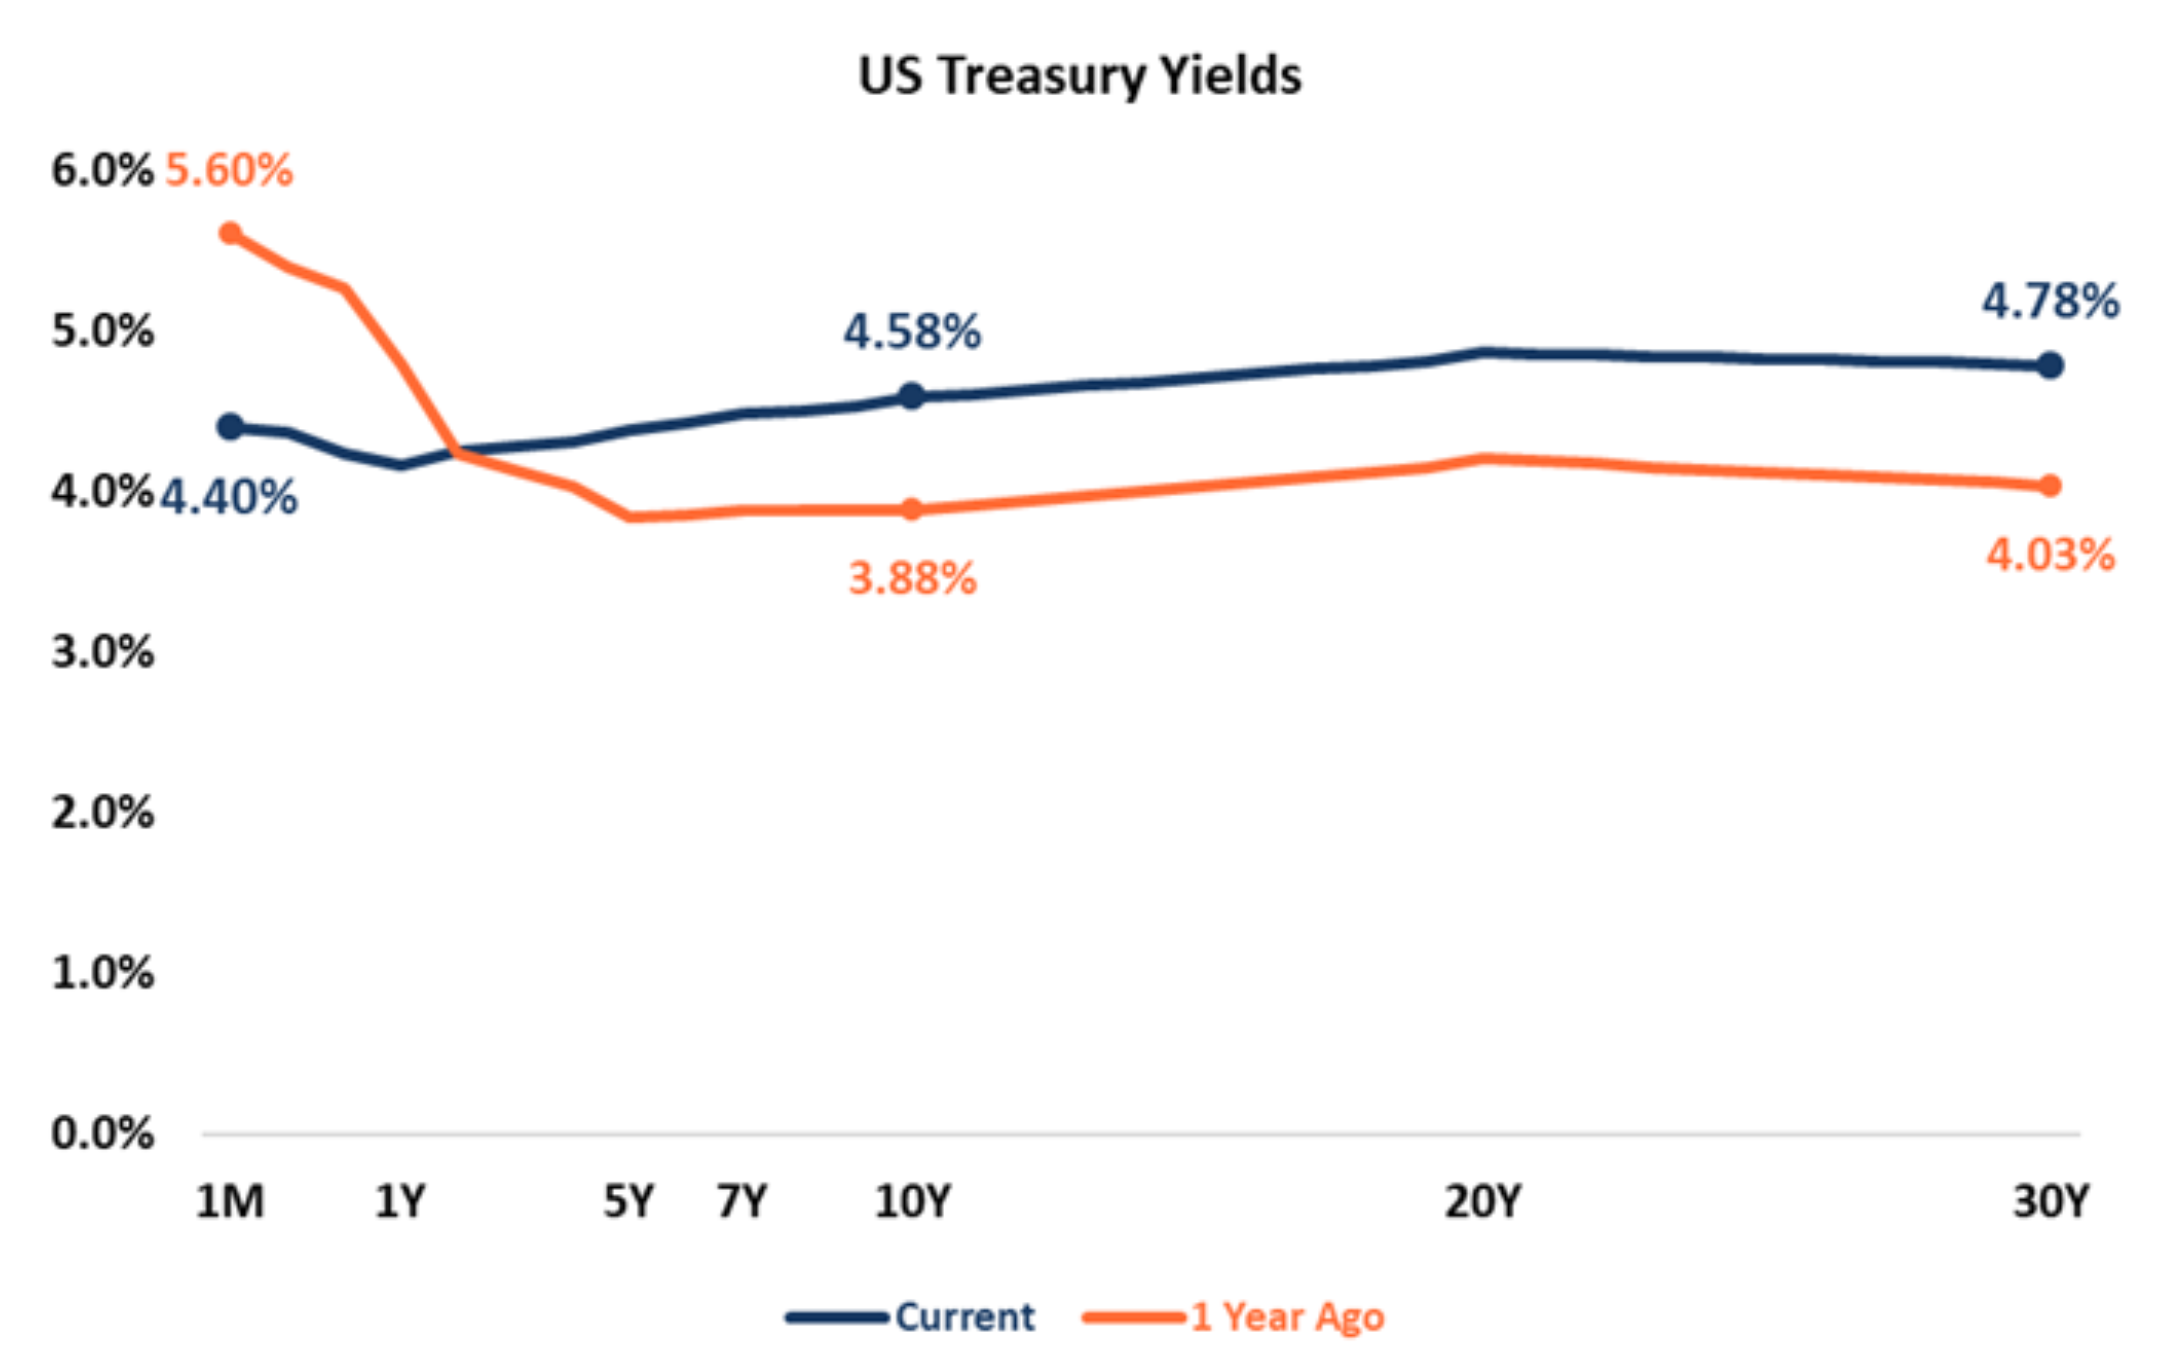
- The U.S. Treasury Yield curve has changed materially over the past year.
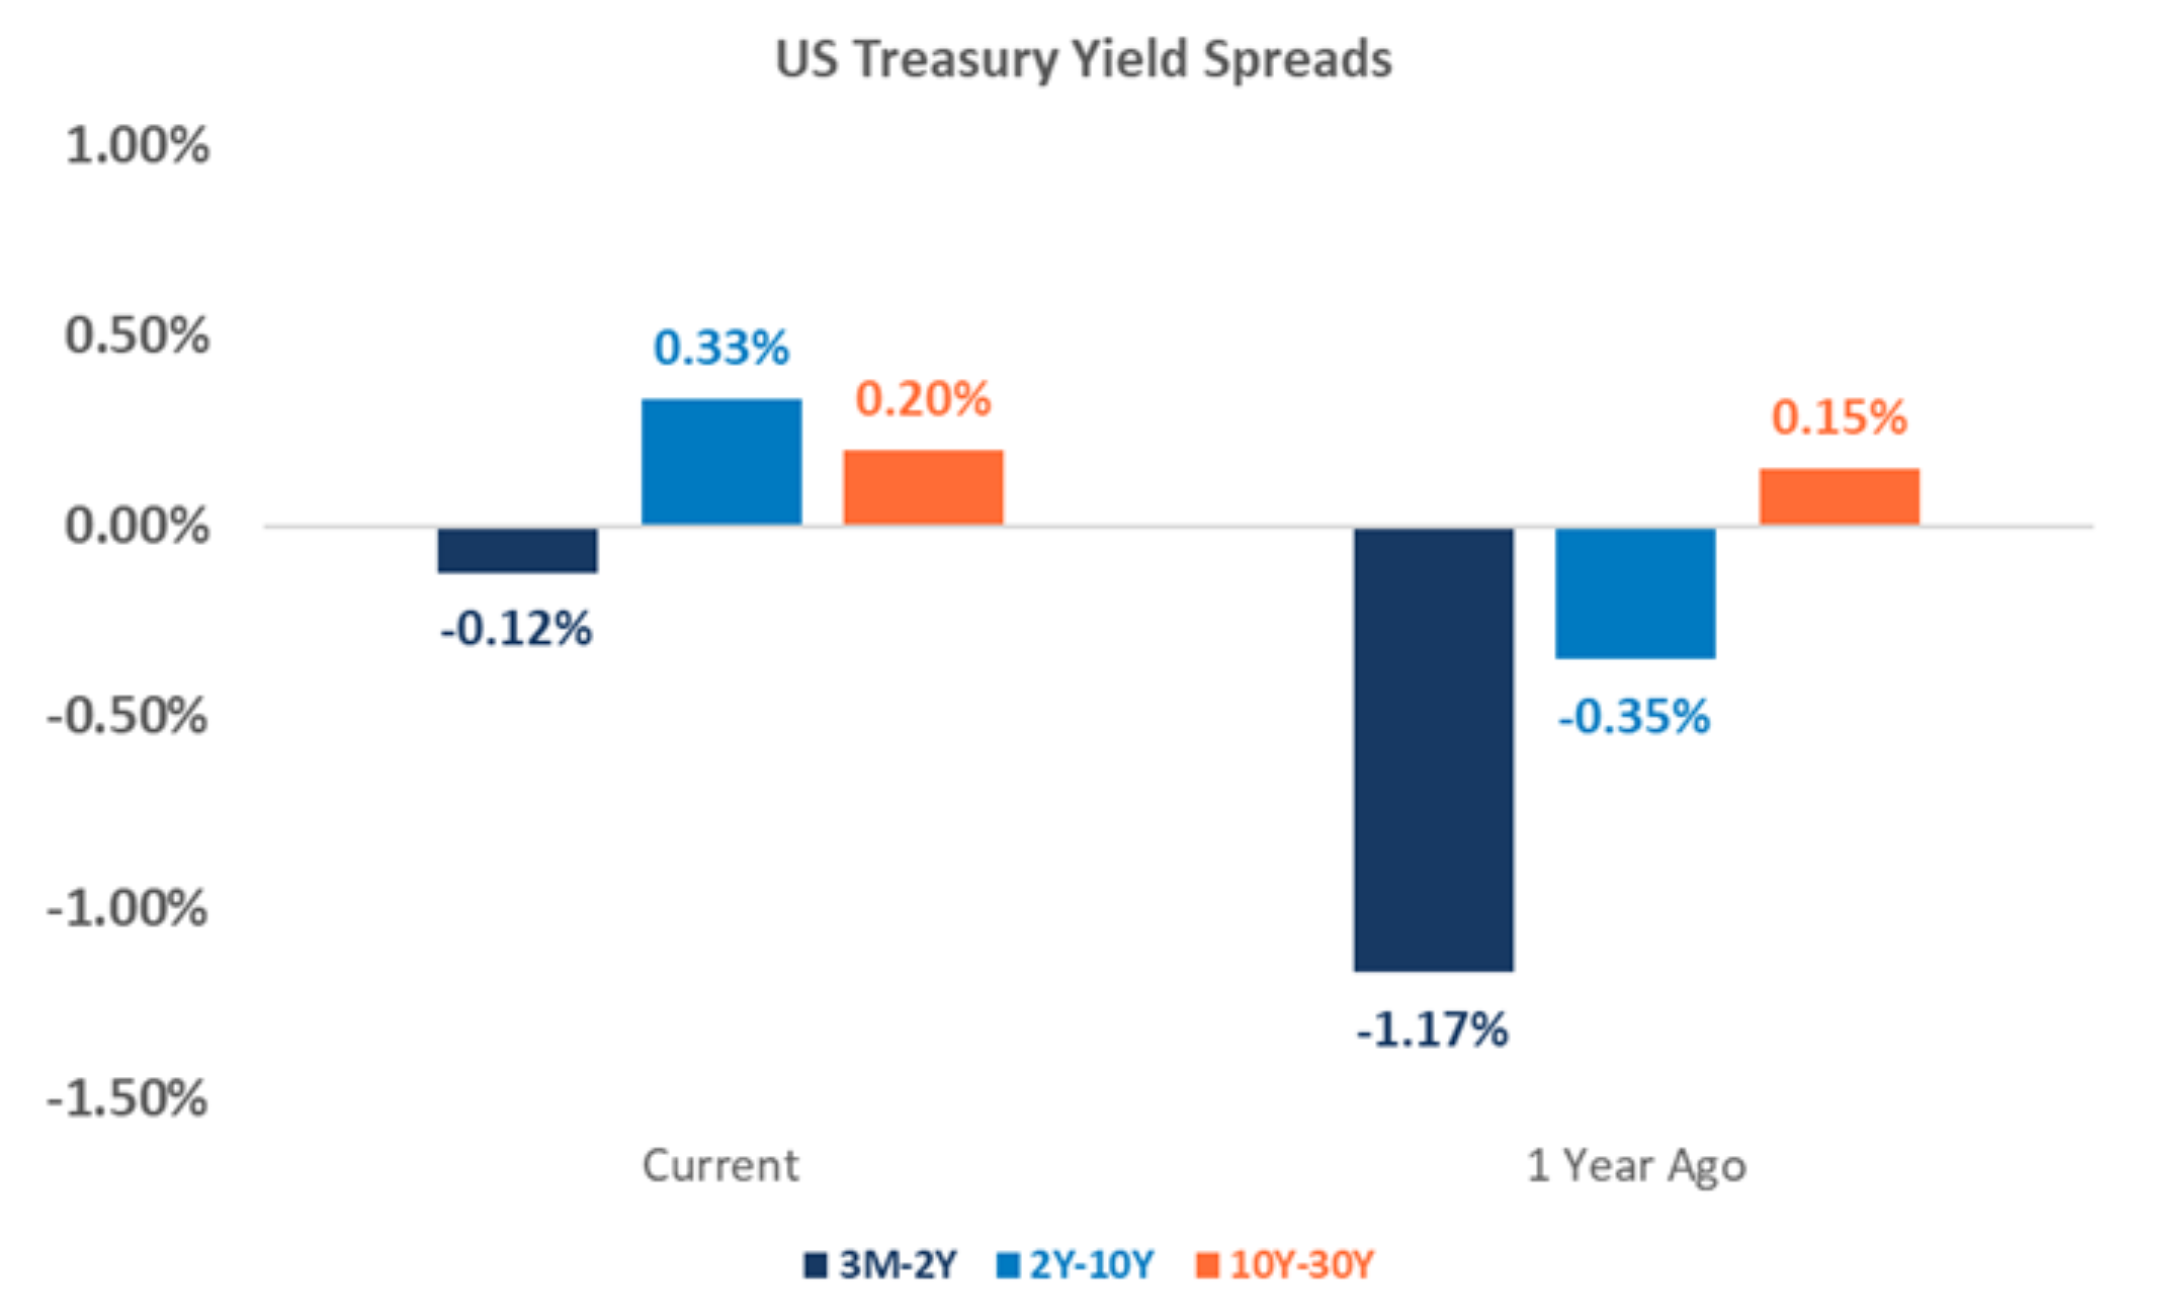
- The yield curve remains inverted at the very short end of the curve, but longer dated term spreads are no longer inverted (ex: 2 year-10 year).
- Short-term yields declined by more than 1% as a result of Fed interest rate cuts.
- Longer-term yields moved higher on short-term concerns over inflation and growing U.S. deficits.
- The yield curve remains inverted at the very short end of the curve, but longer dated term spreads are no longer inverted (ex: 2 year-10 year).
- The yield curve should steepen in 2025 as the Fed expects to cut short-term rates by 0.50% in 2025.
- Note: The Fed could elect to keep short-term rates unchanged should inflation remain stickier-than-expected (and unemployment does not increase materially).
- Takeaway:
- Investors should consider maintaining a short duration posture in their fixed income portfolios until the U.S. Treasury curve steepens more meaningfully.
A Reminder to Long-Term Investors
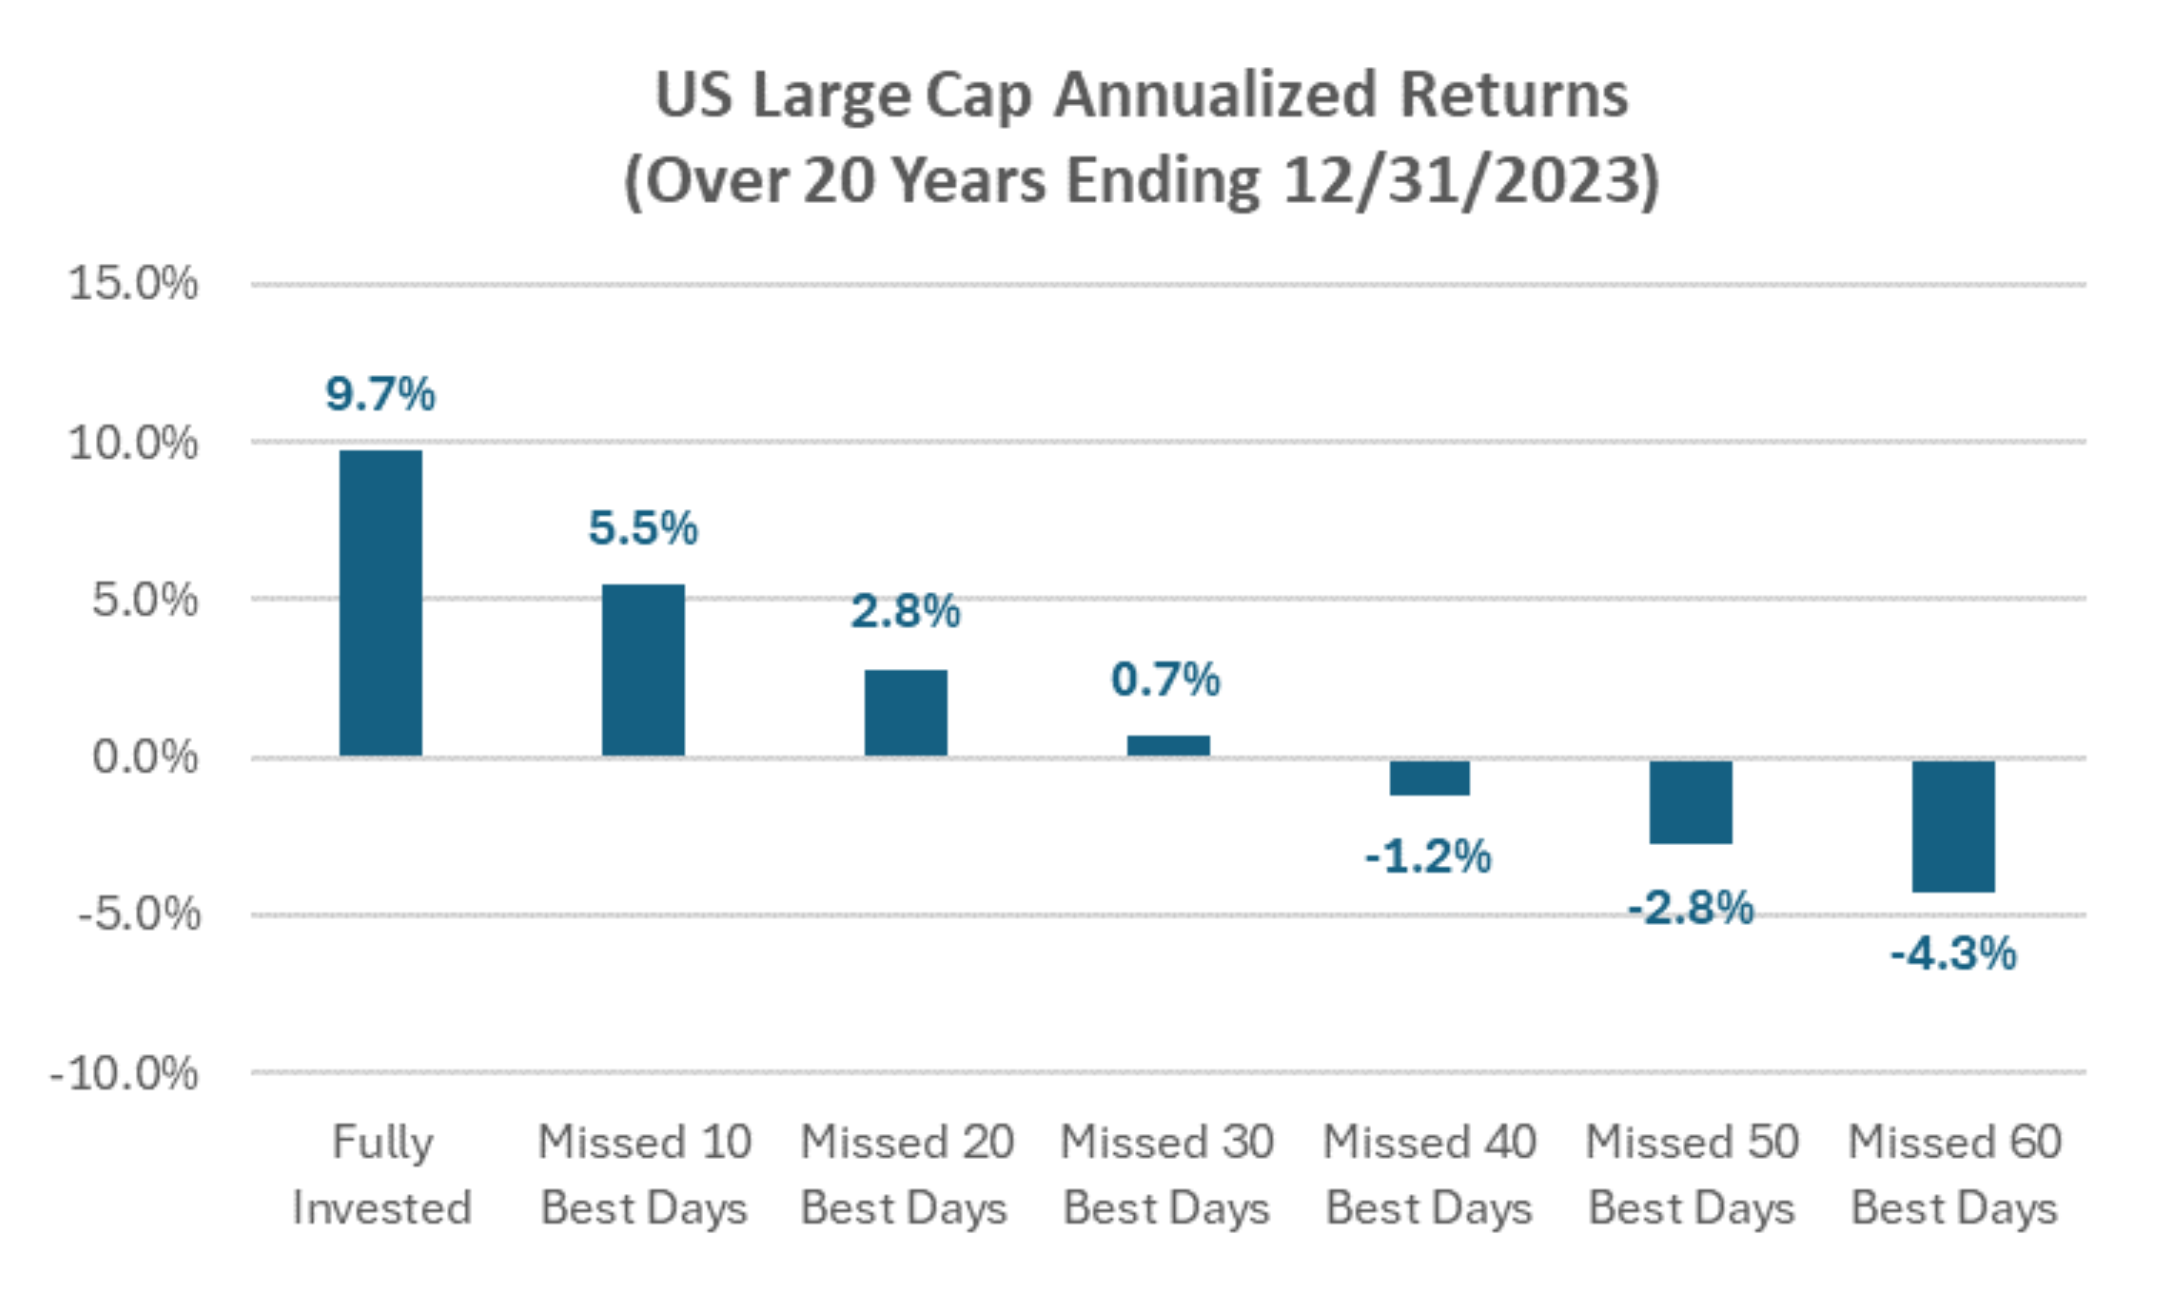
- The chart on the right shows the performance of U.S. Large Cap stocks over a period of 20 years (ending 12/31/2023).
- A U.S. Large Cap investor would have earned an annualized return of 9.7% by staying invested the entire period.
- A U.S. Large Cap investor would have earned an annualized return of 5.5% if they were fully invested in all but the 10 best performance days in the 20-year period.
- A U.S. Large Cap investor would have earned an annualized return of -4.3% if they were fully invested in all but the 60 best performance days in the 20-year period.
- Takeaways:
- Regardless of what may be in store for the macroeconomy and capital markets, long-term investors should avoid the temptation to exit out of markets during periods of elevated uncertainty.
- Long-term investors should never attempt to time the market.
- Riding out market volatility is the best way to build wealth over the long term.
Playbook Summary
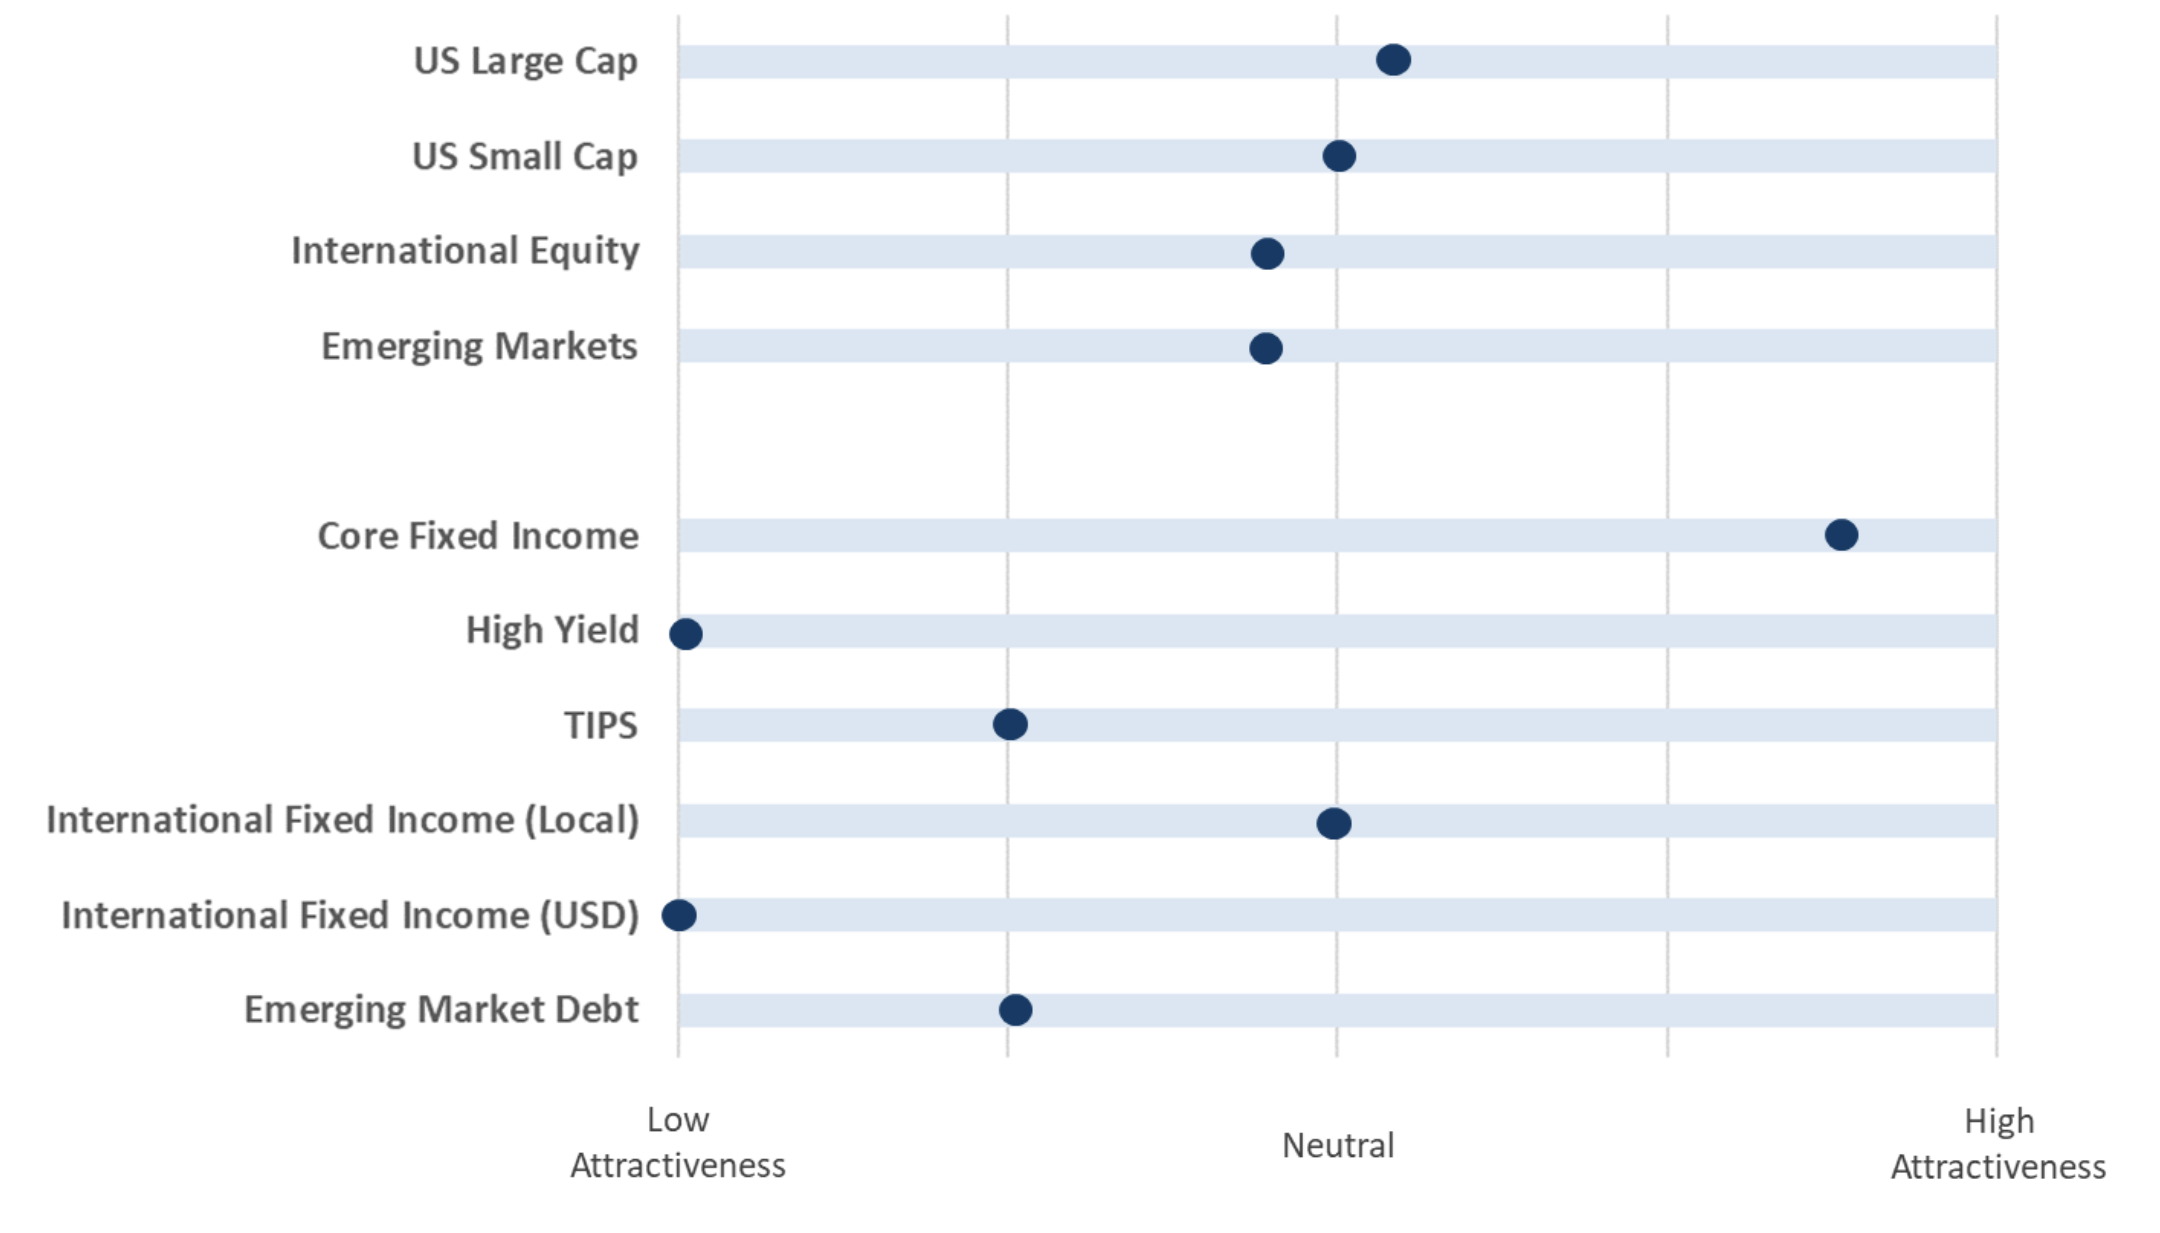
- The above table indicates where each major investment asset class falls on the distribution of attractiveness (from low to high). This table is meant to provide a standardized and comparable view of the level of opportunity in each asset class category.
- In subsequent quarters, we will discuss any movement along the scale for each asset class and the driving forces behind the change in outlook.

