
Capital Markets Playbook | Q4 2024
2024 Q4 Summary
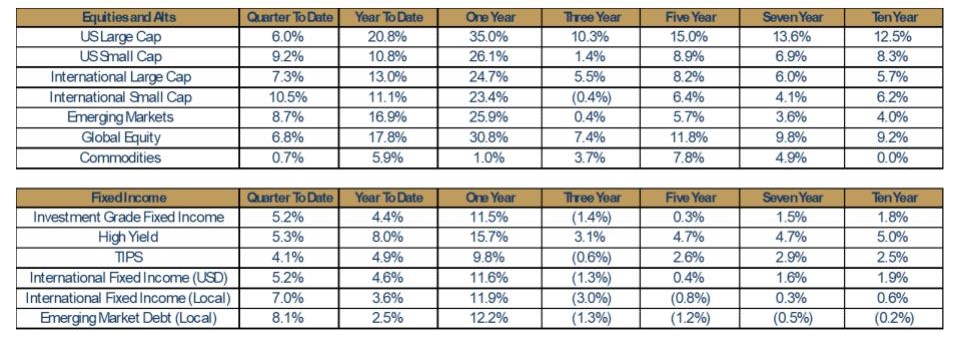
- Equity markets were up solidly in the third quarter of 2024.
- Riskier equity assets classes, U.S. Small Cap (+9.2%), International Small Cap (+10.5%) and Emerging Markets (+8.7%) all outperformed.
- Despite underperforming all major equity asset classes, U.S. Large Cap posted a solid quarter (+6.0%) and is up nearly 21% through the first nine months of 2024.
- Fixed income markets were also up strongly in the third quarter as investors prepared for rate cuts from several central banks.
- All major fixed income assets were up at least 4% in the third quarter.
- Emerging Market Debt (+8.1%) and International Fixed Income (+7.0%) outperformed as local currencies strengthened relative to the U.S. dollar.
2024 Q3: In Review
- 2024 Q3 U.S. Macroeconomic review
- Consumer spending has remained strong enough that the U.S. economy appears set to grow above its longer-term trend rate for the full calendar year.
- Despite the unexpectedly strong economic performance in 2024 however, investors are weighing a number of factors to determine how the economy may perform in the quarters ahead.
- Signals that point to a continuation of economic strength in the U.S.
- Consumer spending growth has slowed, but remains strong.
- Consumers have begun to add to their savings in recent months.
- Unemployment is higher in 2024, but remains very low by historical standards.
- Inflation, while still above The Federal Reserve’s (The Fed) 2% target, continues to decline.
- Signals that point to a slowdown in U.S. economic growth
- Lower income households are experiencing more “inflation exhaustion” and are spending less.
- Credit card and auto loan delinquencies have been growing in recent months.
- Wage growth has been declining as the labor market has cooled.
- Geopolitical conflicts are escalating (ex: Israel, Iran), creating the possibility of higher energy prices and supply chain disruptions.
- Port strikes in the U.S. could have a material impact on U.S. economic growth should the labor dispute remain unsettled.
- Federal debt and fiscal deficits are increasing. Generally speaking, U.S. policy makers appear unwilling to address this issue.
- 2024 Q3 Equity Market Review
- Despite a spike in equity market volatility in August, global equity markets produced strong gains in Q3.
- Broad based U.S. equity markets continued to reach fresh all-time highs in Q3.
- The Dow Jones, Nasdaq and S&P 500 indices finished Q3 at or near all time highs.
- U.S. Small Cap (+9.2%) outperformed U.S. Large Cap (+6.0%) in Q3.
- International Large Cap (+7.3%) posted strong performance as the U.S. dollar declined.
- Emerging Market equities (+8.7%) posted its second solid quarter in a row.
- Chinese equities led all Emerging Market equities in Q3 following the introduction of stimulus measures. Chinese equities were up nearly 20% in the final week of September.
- 2024 Q3 Fixed Income Market Review
- All major fixed income asset classes posted strong gains in Q3 as investors braced for monetary policy normalization from the Federal Reserve and other central banks.
- Most major fixed income asset classes are up 10% or more over the past year after suffering paper losses for much of 2023.
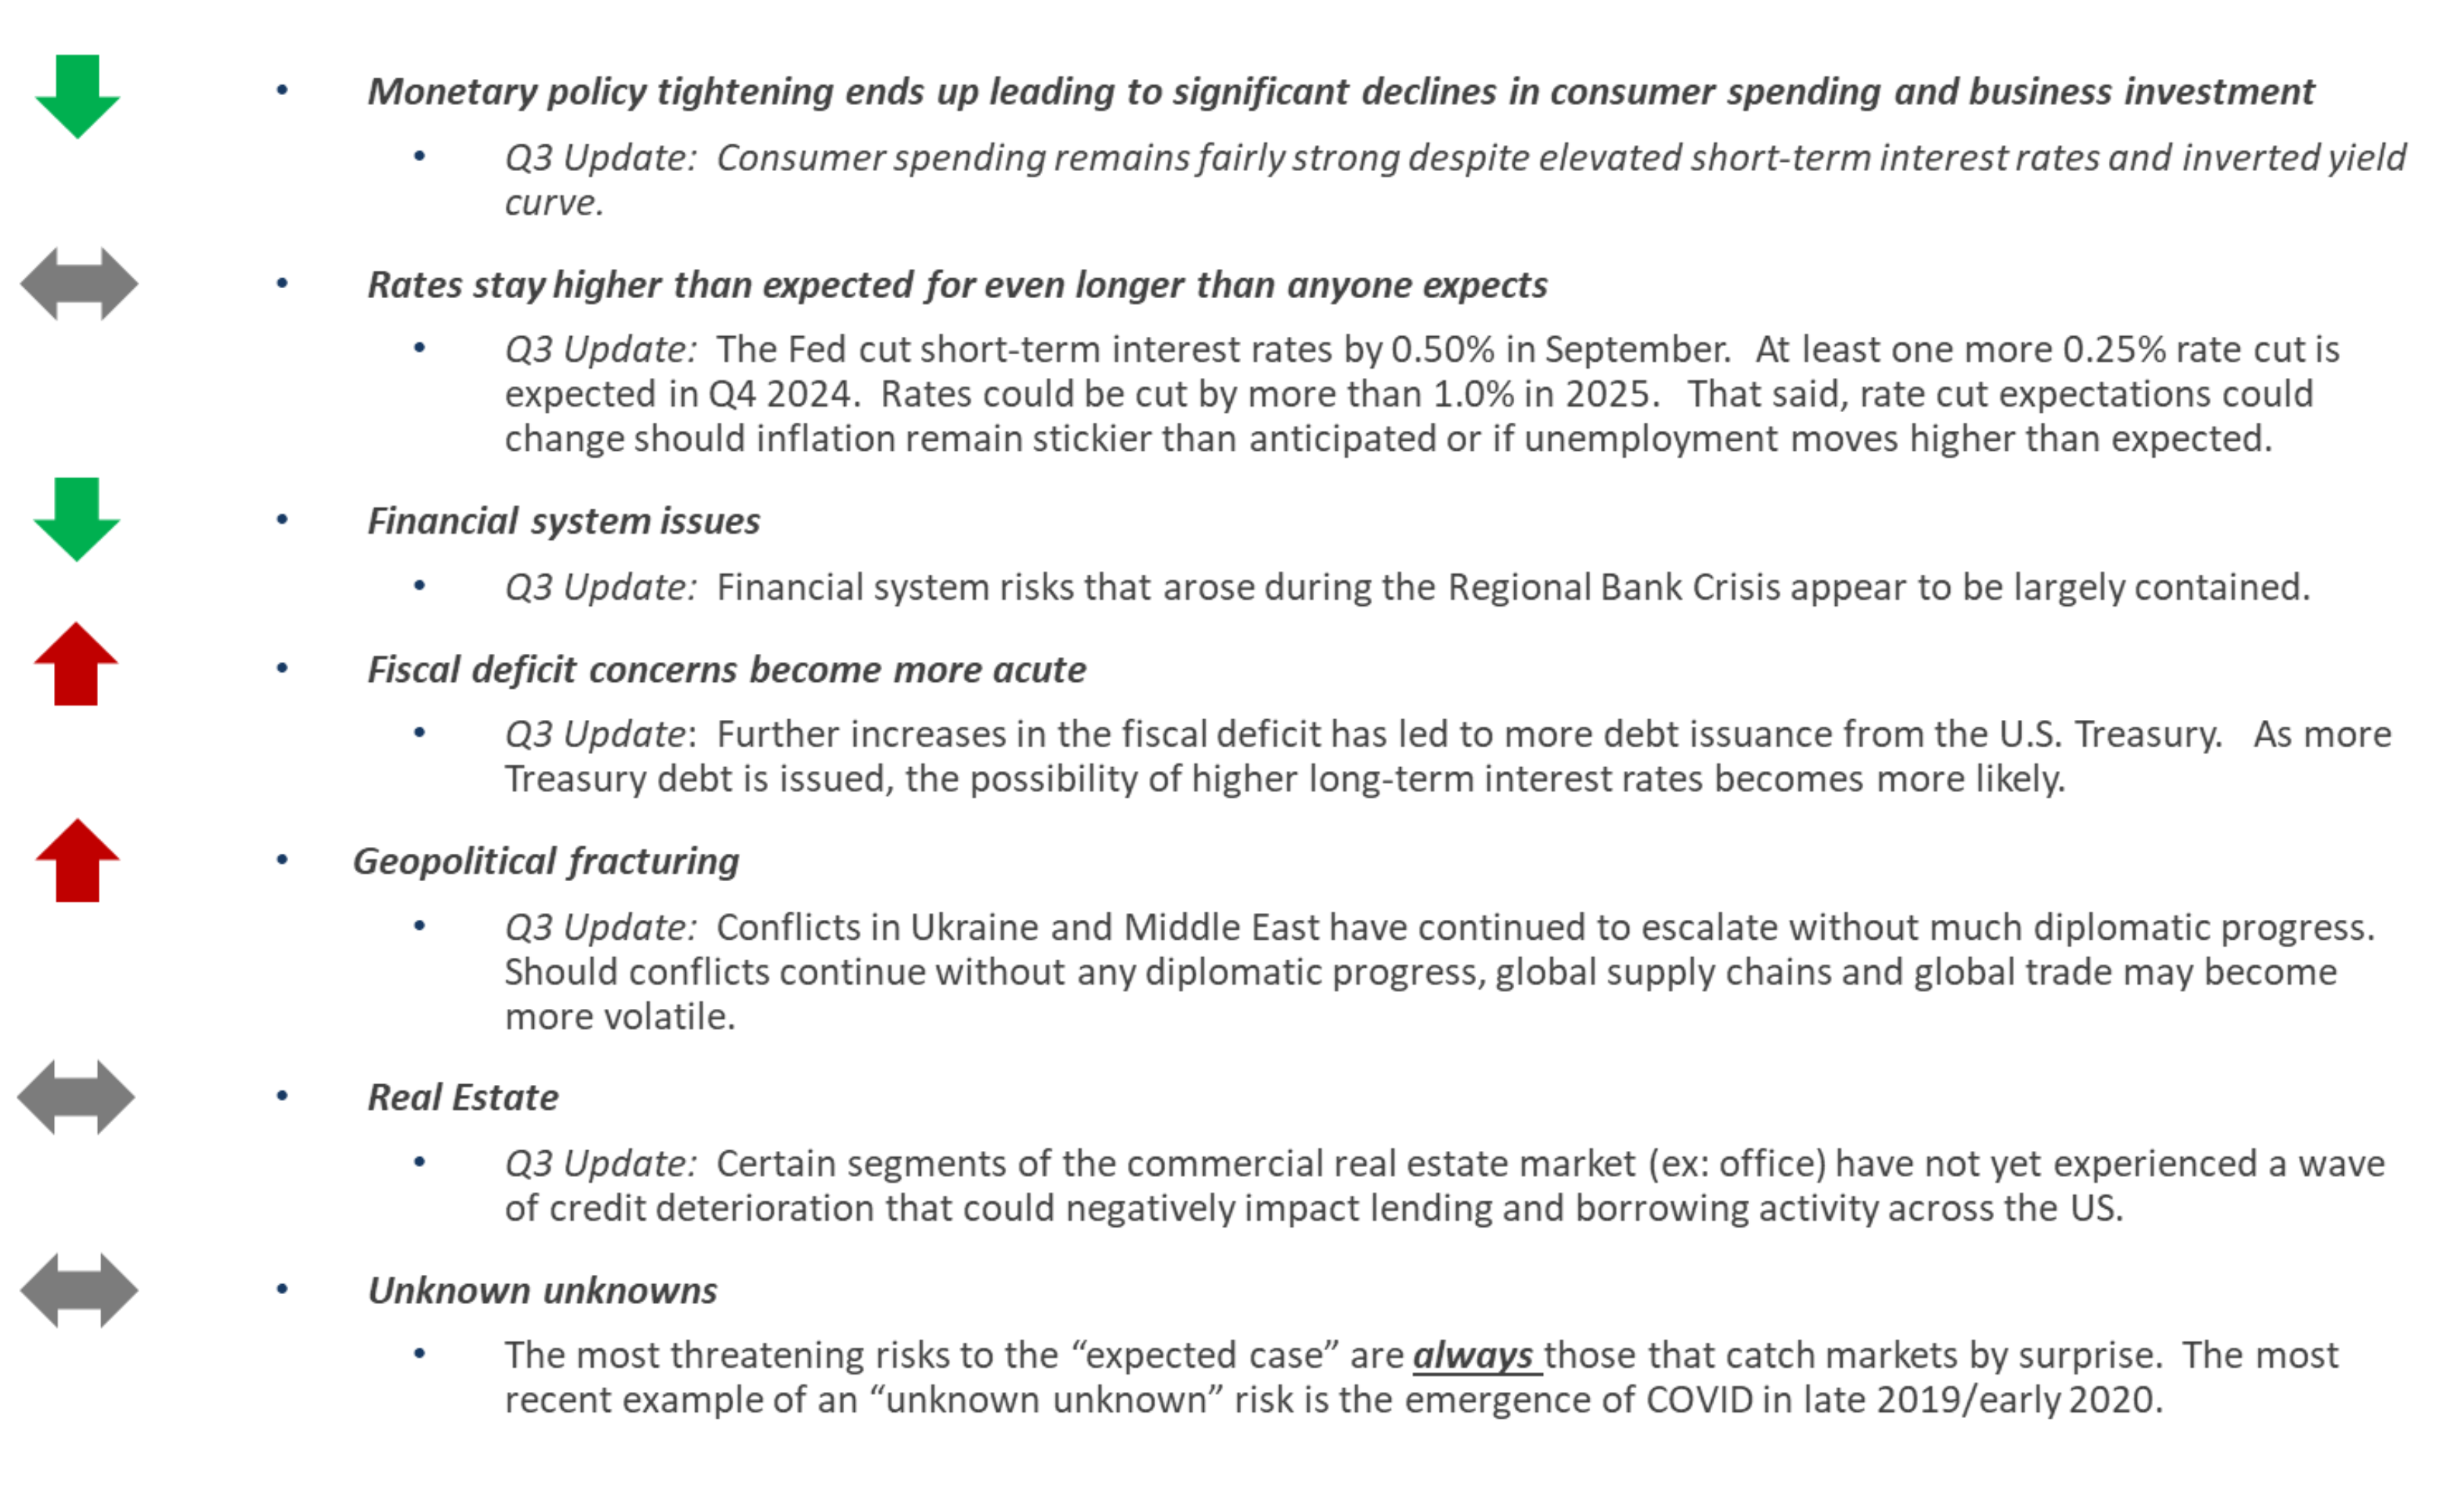
Risks to the "Expected Case" in 2024
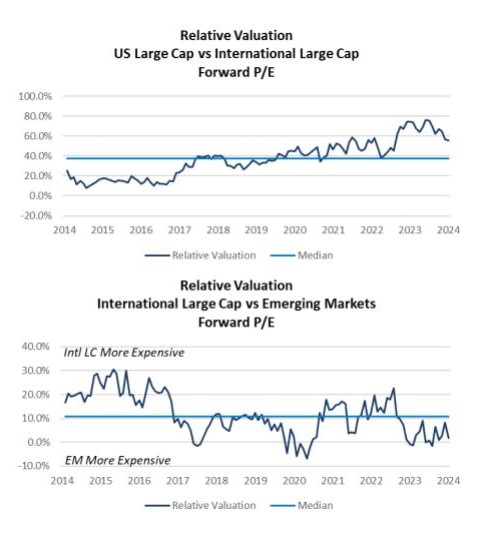
Strong Equity Returns Have Led to Higher Valuations
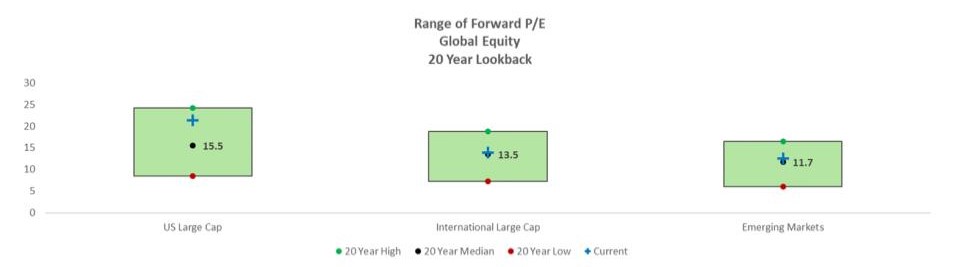
- The chart illustrates the range of Forward Price to Earnings ratio for three major equity asset classes: U.S. Large Cap, International Large Cap and Emerging Markets.
- Forward Price to Earnings Ratio is a fundamental valuation metric that is often used to determine whether an equity asset class is cheap or expensive.
- U.S. Large Cap stocks are currently near the most expensive fundamental valuation level.
- International Large Cap and Emerging Market equities are currently near long term fundamental valuation medians.
- Takeaways:
- Historically speaking, the more expensive stocks are from a fundamental valuation perspective, the lower the future return potential.
- Long-term investors should stay invested in U.S. Large Cap stocks. That said, taking U.S. Large Cap “gains off the table” and reallocating to cheaper equity asset classes (international and emerging markets) may help boost investment returns over the longer-term.
2024 Theme: Slowing Economic Growth
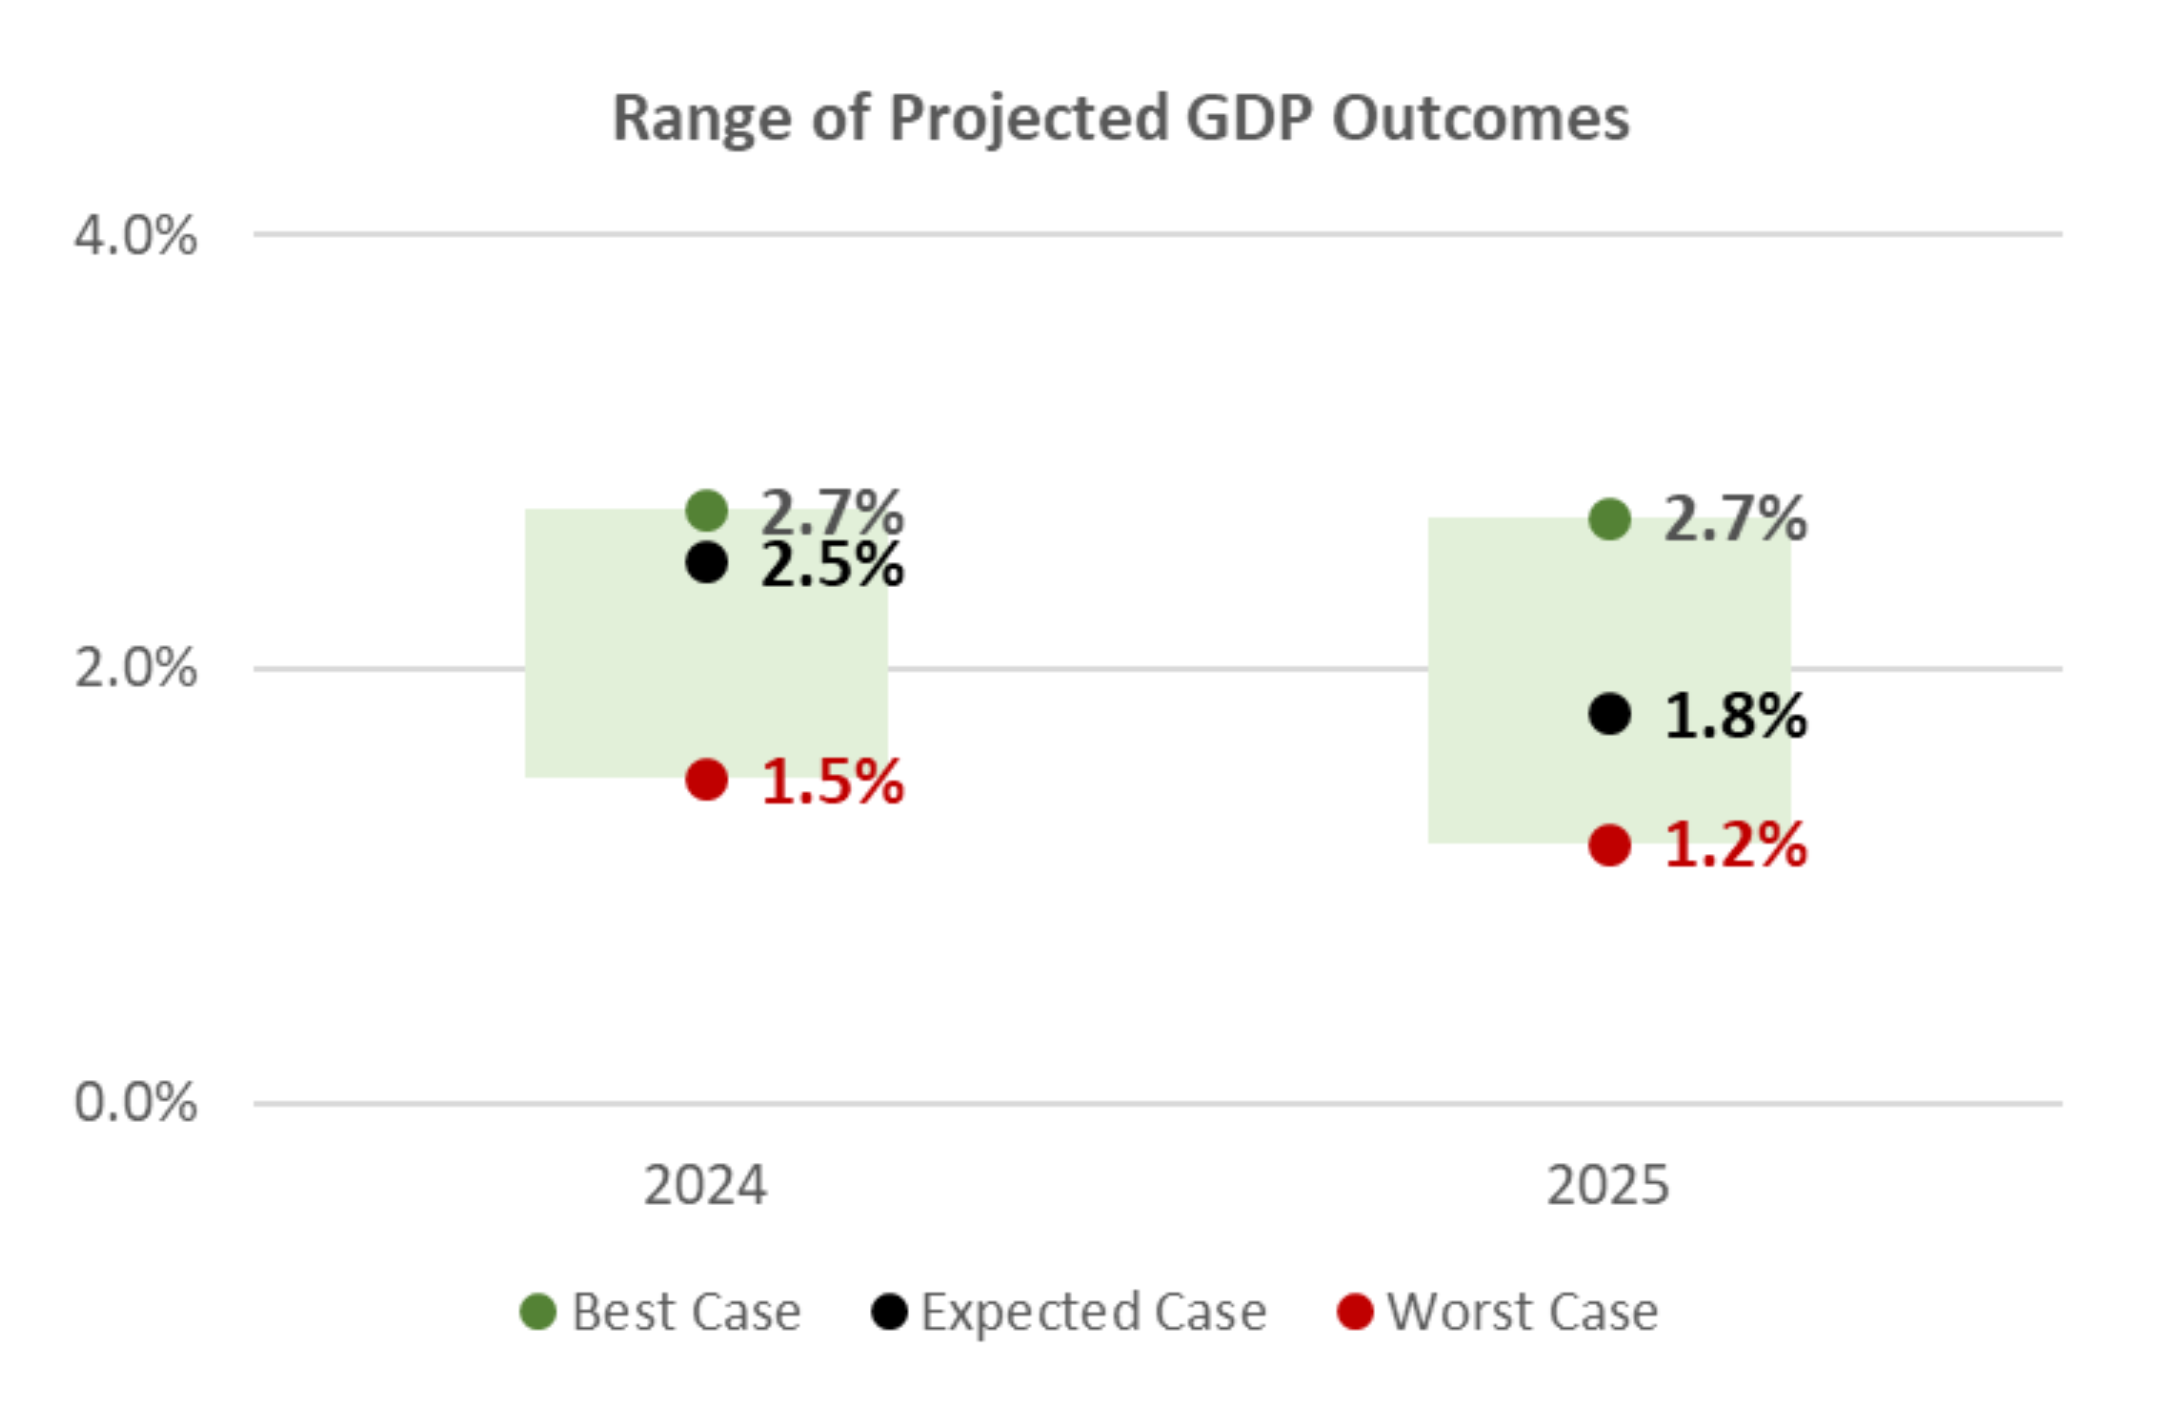
- Economic activity in the U.S. implies that economic growth (“Real GDP”) will be above its long-term average for 2024.
- Economic growth forecasts for the full calendar year 2024 and 2025 have moved slightly higher in recent months as consumer spending has held up better than originally expected.
- Stronger than expected growth has also lowered the probability of a recession in 2024 and 2025.
- Note: Given the recent mixed economic signals, however, it is possible U.S. economic growth expectations change meaningfully in the months ahead.
- Scenarios:
- Best Case
- Economic activity in the U.S. is about 0.5% above its long-term trend rate over the next two years.
- Expected Case
- Economic activity in the U.S. is in line with long-term trend rates over the next two years.
- Worst Case
- Economic activity is 0.5% to 1.0% below its long-term trend rate over the next two years.
- A “mild” economic recession cannot be ruled out in the event of a “worst case” economic scenario.
- Best Case
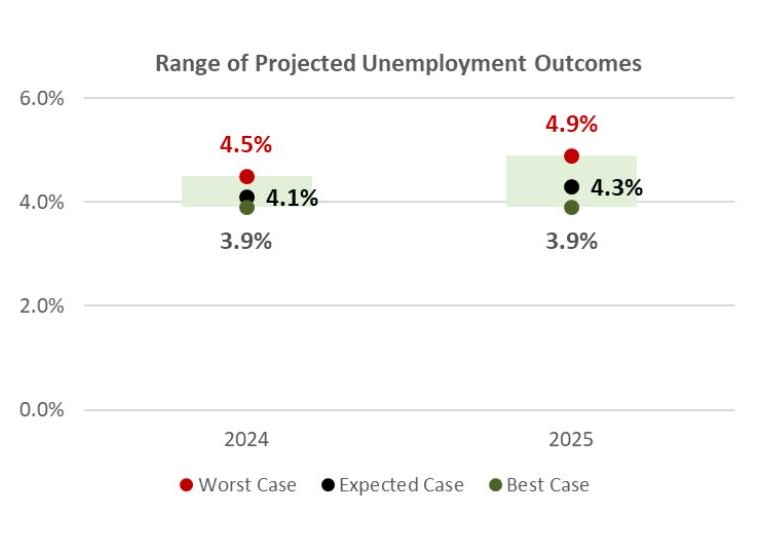
2024 Theme: Higher Unemployment, Slower Wage Growth
- The labor market has begun to cool in recent months, but unemployment remains near historical lows (4.2%).
- Labor force participation rates are the primary driver for the increase in unemployment in 2024.
- Wage growth has continued to normalize and is close to pre-pandemic levels.
- Scenarios:
- Best Case
- Unemployment declines slightly from its current level and remains near historical lows over the next two years.
- Expected Case
- As economic growth slows in the U.S., unemployment ticks higher, but remains low by historical comparison.
- Worst Case
- Unemployment approaches 5.0% by the end of 2025 as a result of meaningfully slower economic growth.
- Best Case
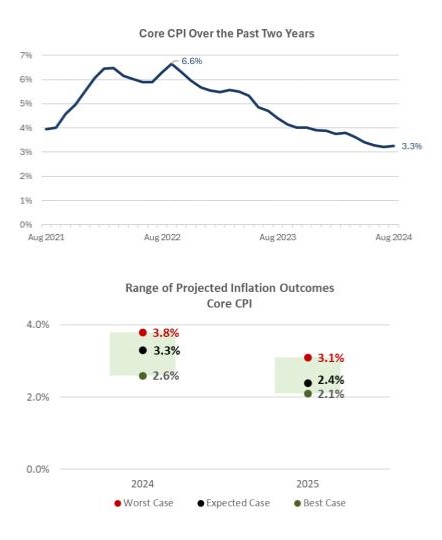
2024 Theme: Slowing Inflation
- Inflation continues to slow in the U.S. despite stickiness within certain inflation categories.
- Core Consumer Price Index (CPI) has declined from 6.6% to 3.3% since the summer of 2022.
- Stickiness within housing and shelter related inflation has kept inflation from falling even further over that time.
- The Fed’s preferred measure of inflation, Core Personal Consumption Expenditures (Core PCE) has declined to 2.7% (only 0.7% above the Fed’s inflation target).
- Core Consumer Price Index (CPI) has declined from 6.6% to 3.3% since the summer of 2022.
- Scenarios:
- Best Case
- Inflation falls as a result of slower economic growth and is close to the Fed’s long-term inflation target before the end of 2025.
- Expected Case
- Inflation continues to moderate slowly and is slightly higher than the Fed’s 2% target by the end of 2025.
- Worst Case
- Inflation continues to be sticky throughout the aggregate economy and remains well above the Fed’s long-term inflation target through the end of 2025.
- Best Case
2024 Playbook: International Equity
- Fundamental valuation metrics suggest that US equities are “expensive” on a relative basis.
- International equities and Emerging Market equities are more attractive than U.S. Large Cap on a relative valuation basis.
- Economic considerations:
- If global economic growth surprises to the upside, International and Emerging Market equities will likely outperform U.S. equities.
- If there is a global economic recession, U.S. equities will likely outperform International and Emerging Market equities.
2024 Playbook: US Equity
- Fundamental valuation metrics suggest that “Growth” equities are still substantially more expensive than “Value” equities.
- Economic considerations:
- “Value” equities carry less risk than “Growth” equities. Growth stocks typically sell off more than Value stocks as concerns over economic growth materialize.

2024 Playbook: Fixed Income
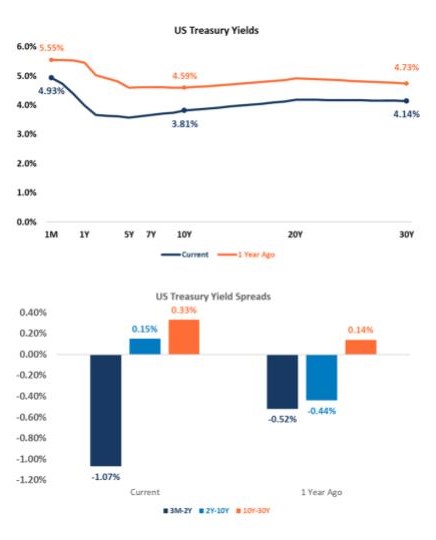
- Key sections of the U.S. Treasury yield curve have begun to steepen as investors prepare for rate cuts from the Fed.
- The 2-10 year U.S. Treasury spread has recently become “un-inverted” after being inverted for more than 500 days.
- Yield curve inversion occurs when short-term rates are higher than long-term rates.
- Other term spreads (ex: 30 day - 2 year and 30 day - 10 year) remain inverted and are likely to stay that way until the Fed’s short-term policy rate nears its “neutral level”.
- Expected “neutral” short-term policy rate: 2.75%-3.00%
- The 2-10 year U.S. Treasury spread has recently become “un-inverted” after being inverted for more than 500 days.
- Takeaways:
- As the Fed cuts its short-term policy rate and the yield curve normalizes (i.e. steepens) short duration fixed income may no longer offer the same yield advantages it has over the past couple of years.
- Investors should consider reallocating a portion of short duration fixed income into longer duration fixed income.
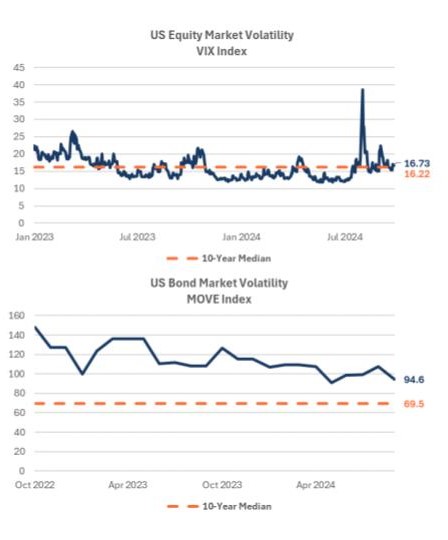
2024 Theme: Market Volatility
- Equity market volatility spiked significantly over a short period of time in Q3. Volatility has since fallen, but remains higher than it had been in the first half of 2024.
- Volatility in fixed income markets has been declining in recent months, but remains far higher than normal.
- Equity market volatility is likely to remain elevated in the final months of 2024 as markets weigh the potential impact of U.S. elections, Fed monetary policy changes and geopolitical issues.
- Takeaways:
- Market volatility is, by definition, a function of uncertainty.
- Volatility will decline as market participants have more clarity into the future of inflation, monetary policy, economic growth, etc.
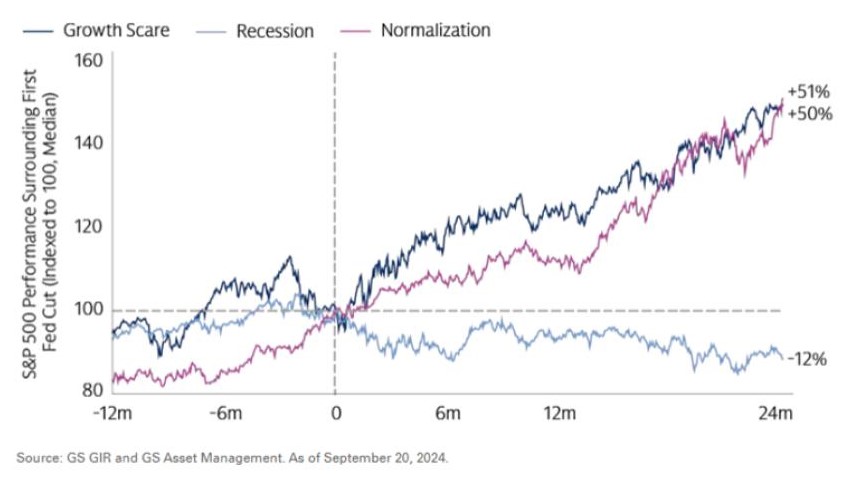
Equity Market Performance and Rate Cuts
- Market participants often rely on the, “Don’t Fight the Fed” rule of thumb when the Fed begins to cut interest rates.
- “Don’t Fight the Fed” rule of thumb: If the Fed is reducing interest rates, equity investors should take more risk as equity markets tend to outperform expectations during Fed rate cuts.
- Like many rules of thumb in the investment world, the “Don’t Fight the Fed” strategy is overly simplistic and is not true all of the time.
- The chart on the right shows how U.S. Large Cap stocks perform during Fed rate cut cycles.
- U.S. Large Cap stocks outperform so long as the economy does not enter into a period of economic recession prior to (or during) Fed rate cut cycles.
- U.S. Large Cap stocks have posted an average loss of 12% (over a two-year period) when rate cuts take place prior to (or during) an economic recession.
- Takeaway:
- Should the U.S. enter into an economic recession, taking more risk during Fed rate cut cycles could end up being a losing strategy.
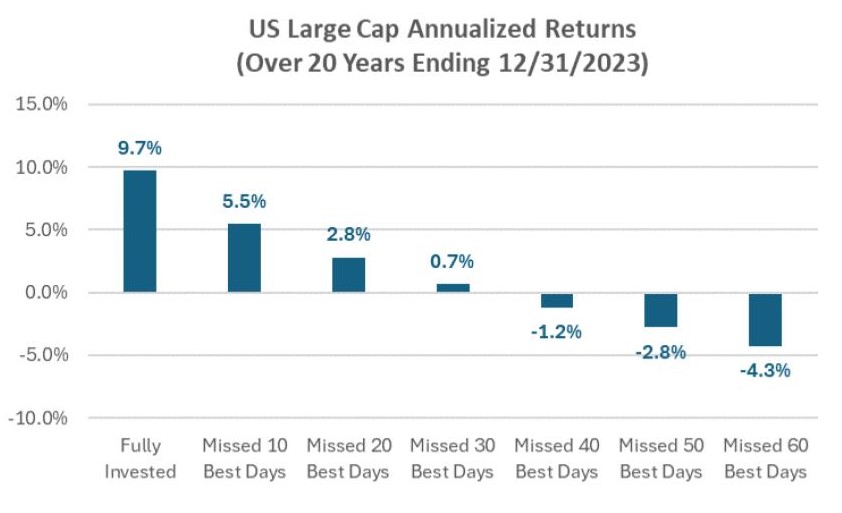
A Reminder to Long-Term Investors
- The chart on the right shows the performance of U.S. Large Cap stocks over a period of 20 years (ending 12/31/2023).
- A U.S. Large Cap investor would have earned an annualized return of 9.7% by staying invested the entire period.
- A U.S. Large Cap investor would have earned an annualized return of 5.5% if they were fully invested in all but the 10 best performance days in the 20-year period.
- A U.S. Large Cap investor would have earned an annualized return of -4.3% if they were fully invested in all but the 60 best performance days in the 20-year period.
- Takeaway:
- Regardless of what may be in store for the macroeconomy and capital markets, long-term investors should avoid the temptation to exit out of markets during periods elevated uncertainty.
- Long-term investors should never attempt to time the market.
- Riding out market volatility is the best way to build wealth over the long-term.
2024 Playbook Summary
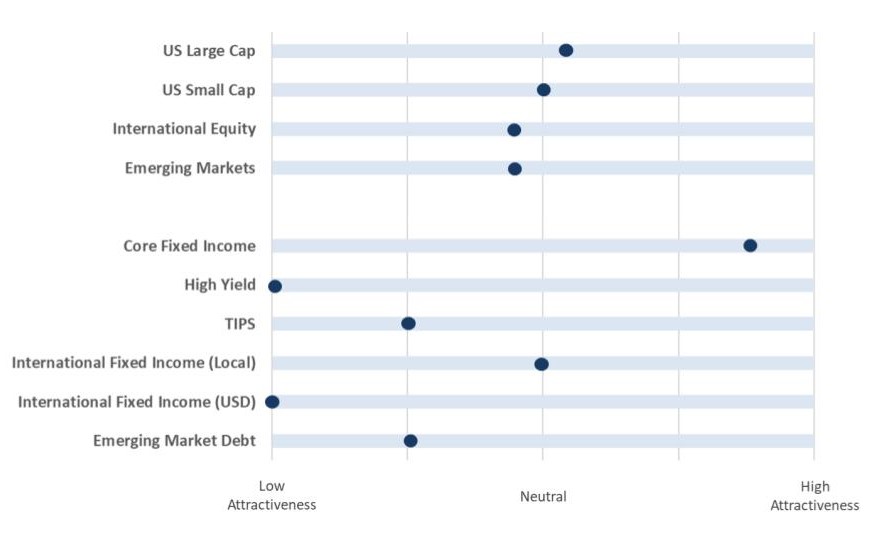
- The above table indicates where each major investment asset class falls on the distribution of attractiveness (from low to high). This table is meant to provide a standardized and comparable view of the level of opportunity in each asset class category.
- In subsequent quarters, we will discuss any movement along the scale for each asset class and the driving forces behind the change in outlook.

