
Capital Markets Playbook | Q2 2025

2025 Q1 Summary
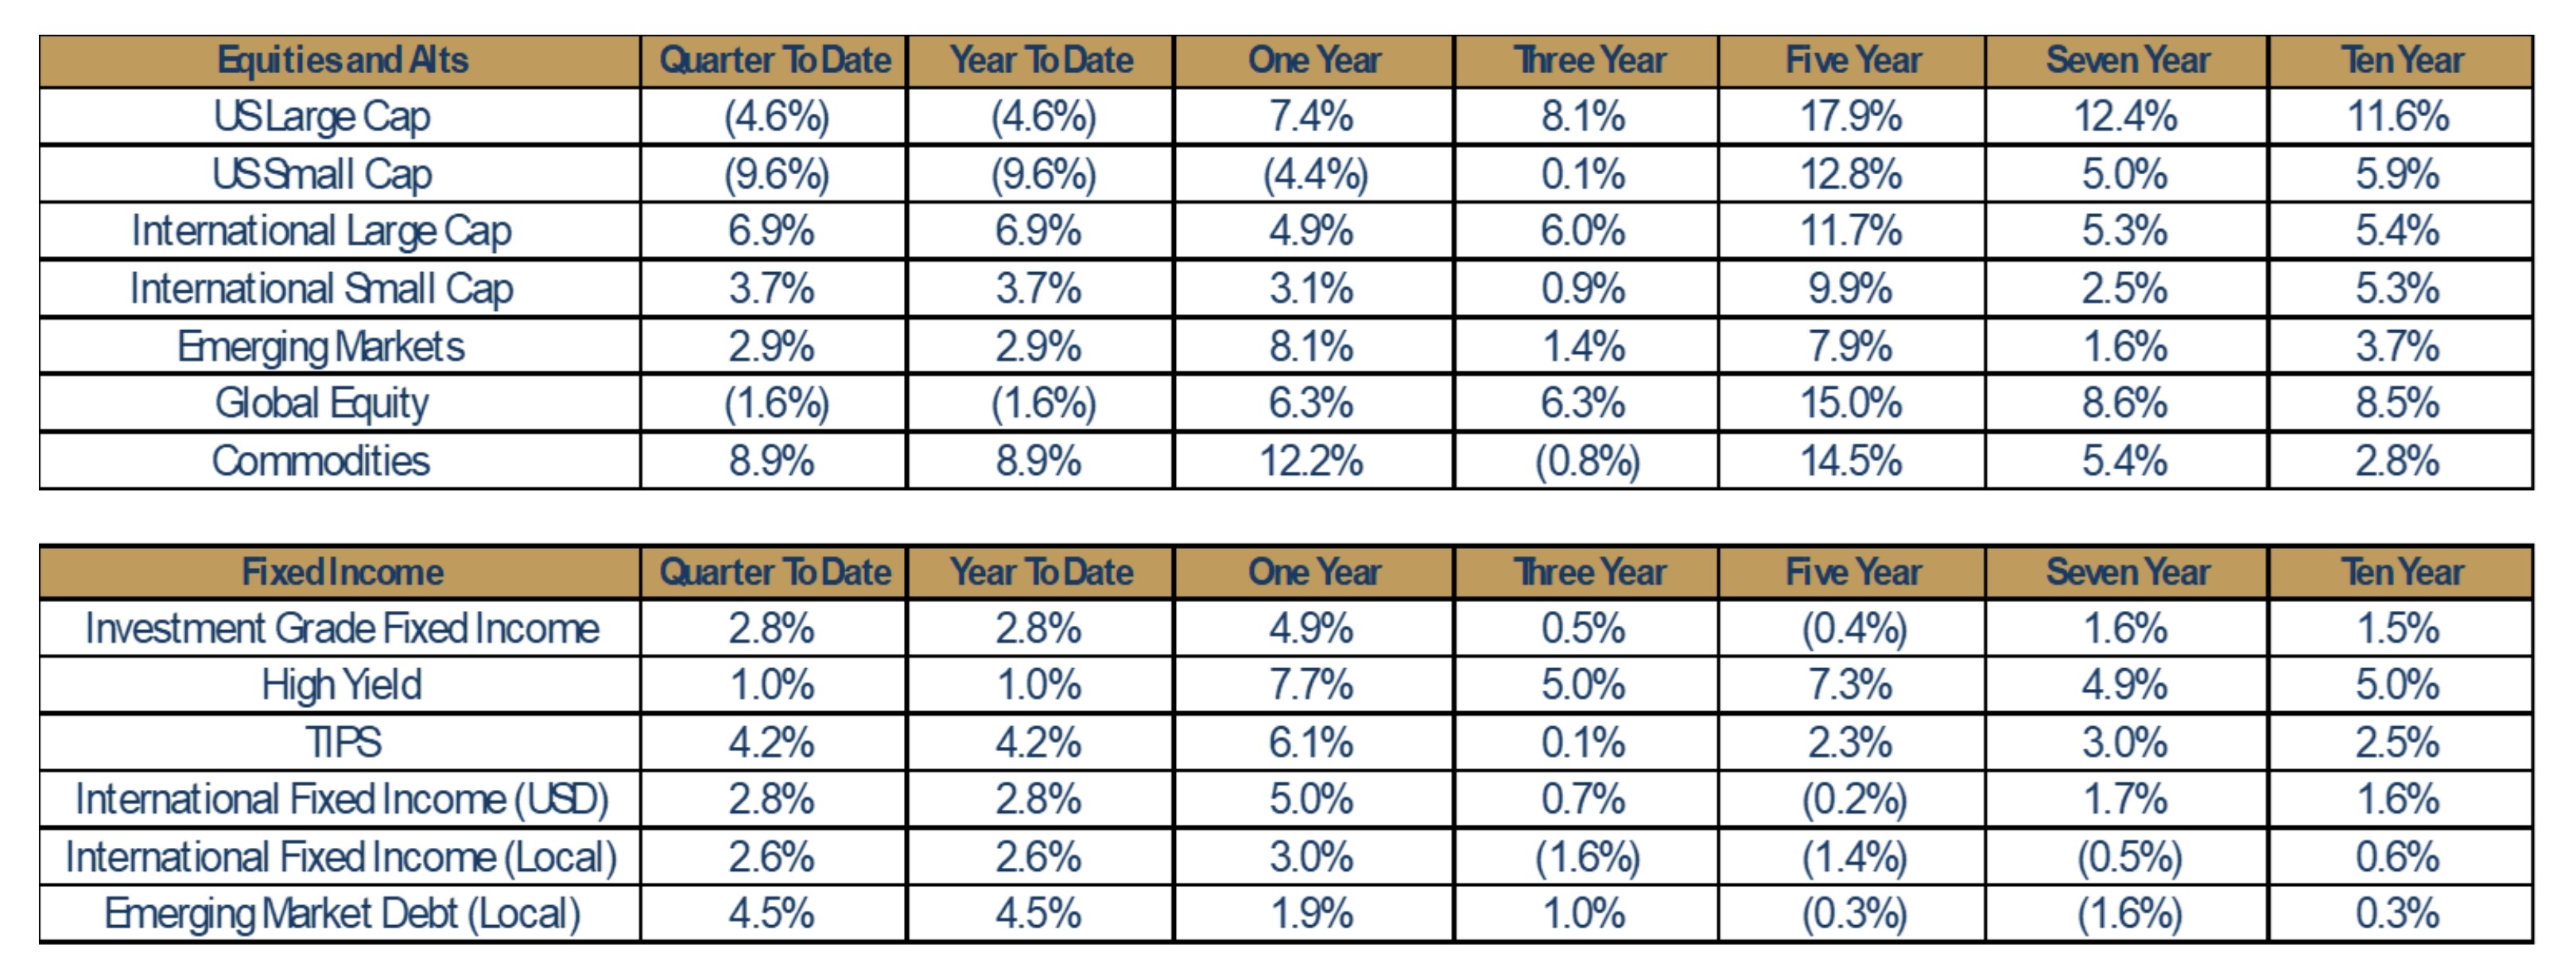
- Equity markets were mixed in the first quarter of 2025.
- Domestic equity assets classes, U.S. Large Cap (-4.6%) and U.S. Small Cap (-9.6%), were down significantly. The Magnificent Seven stocks collectively fell into bear territory during the quarter.
- Equity asset classes outside the U.S. however outperformed materially. International Large Cap was the best performing equity asset class in the quarter (+6.9%).
- Fixed income markets were positive in the first quarter of 2025. Uncertainty has given way to volatility in the equity market, which led to a flight to safety.
- Treasury Inflation-Protected Securities (TIPS) showed strength as inflation came in higher than expectations throughout the quarter.
- U.S. Dollar weakness led to outperformance in local currency fixed income asset classes.
A Summary of Recent Market Events
- Volatility in global capital markets spiked in early April, following President Trump’s tariff announcements. Market participants were expecting new, broad-based tariffs to be announced, but consensus expectations materially underestimated their severity and reach, jolting markets around the globe.
- The tariff announcements, simply put, have created significant uncertainty for market participants, businesses and consumers. Given the complexity of global trade partnerships, global supply chains and the tariffs themselves, it is impossible for anyone to know just how negative of an impact the new tariffs will have on the U.S. economy. While it is safe to assume that the announced tariffs are not good for economic growth, the magnitude of any economic slowdown depends on a variety of factors that are impossible to predict today. As a result of this elevated uncertainty, investor sentiment has soured quickly, and high volumes of risk assets have been sold.
- Over the days following the tariff announcement, U.S. equity markets sold off and U.S. Treasury yields dropped significantly. The S&P 500, for example, was down about 10% over two days. Treasury yields, particularly longer dated treasury yields, declined by at least 20bps following the announcement as investors purchased bonds in a flight to safety. By the second week of April, bond yields began to rebound somewhat. Equity markets on the other hand continued to decline as the uncertainty remains.
- As of the time of this writing, a 90-day pause on country-specific tariffs has been announced (on countries that have not retaliated). The markets responded quickly, erasing much of the decline from the prior week. Despite the pause in reciprocal tariffs, the underlying uncertainty related to trade policy remains. The situation will continue to change in the weeks ahead. Despite the market’s positive reaction to the “pause,” volatility will likely remain elevated until there is further clarity.
Overview of the Tariff Announcement
- A high-level summary of the new tariffs:
- Starting April 5, a 10% baseline tariff was applied to all imported goods.
- Reciprocal tariffs were also issued to select countries, in addition to the baseline tariffs mentioned above, and are scheduled to go into effect on April 9. These reciprocal tariffs were issued on countries including China, Taiwan, Japan, Cambodia, South Africa, Brazil and the UK, among others.
- Product-specific tariffs for aluminum, steel and auto imports that were already in place will not have reciprocal tariffs applied on top of the 25% tariffs. That exemption also applies to pharmaceuticals, semiconductors and lumber – which could be subject to 25% tariffs in the future.
- In terms of countries, some of the largest tariffs have been applied to China, Vietnam, Taiwan and Indonesia. It appears that these large tariffs aimed at small Asian economies, such as Vietnam, are intended to prevent China from using those countries to circumvent tariffs levied on China. India will have a 26% tariff applied to its goods, the EU will have a 20% tariff applied to its goods and Japan will have a 24% tariff applied to its goods. Canada and Mexico received far lower tariffs.
- Following the announcement, many countries immediately reached out in an attempt to negotiate, and the Administration said each would be handled on a country-by-country basis.
What Should Investors, Businesses and Consumers Expect Assuming that the Announced Tariffs Stay in Place?
- The announced tariffs will place a high burden on U.S. consumers and businesses. The price of goods is likely to rise in the short term, and this increase would eventually lead to lower demand, lower spending and lower prices. Since consumer spending represents about 70% of annual economic activity in the U.S., any material slowdown in spending would bring lower corporate earnings, lower equity prices, higher unemployment and potentially an economic recession in the U.S. The bottom line is that the longer the announced tariffs stay in place, the more painful the economic outcomes become.
How Long Might the Announced Tariffs Stay in Place?
- Given the complexity of the situation, it is impossible to know just how long the tariffs will remain in place. That said, the tariffs that have been announced seem to provide some room for negotiation. For example, some of the new tariffs have staggered implementation dates. This framework supports the idea that new tariffs are being used as a bargaining tool and are not expected to be long term in nature. In fact, some countries have already indicated they will reduce the tariffs they apply to U.S. imports as a result of the announcement.
- Some of the new tariffs are so high that they essentially will stop all trade with the U.S. The tariffs on China, for example, are so high as to be almost completely restrictive for U.S.-China trade. This suggests it is unlikely they will be long term in nature. However, we have only seen an escalation of tariffs between the U.S. and China in the days following the original announcement.
- Digging deeper, domestic politics are also a consideration. With U.S. midterm elections coming in 2026, there are some concerns within the Republican party that the drastic changes within U.S. trade policy and the uncertainty it has created may result in a loss of Congressional majority. Without a majority in Congress, it is unlikely that the Trump administration will have the support it needs to fulfill its agenda. (Note: Recent polls suggest that most Americans, at least initially, are unhappy with the tariffs that were announced.)
- A long-lasting trade war would certainly throw the entire global economy into an economic recession. While some trade partners currently have adversarial relationships, none of those parties wish to intentionally force their domestic economies into decline when compromises may be possible.
How Will Tariffs Impact Monetary Policy in the U.S.?
- The new tariffs create even more monetary policy uncertainty in the U.S.
- In the short term, as noted previously, new tariffs are expected to be more inflationary across the aggregate U.S. economy. In this scenario, assuming unemployment does not increase materially, the Federal Reserve (the Fed) is unlikely to reduce its short-term policy rate any time soon.
- Should the new tariffs remain in place for a longer period of time (several months or more), any short-term increase in inflation will likely slow aggregate demand. Slower aggregate demand will lead to higher unemployment and lower inflation. In this scenario, the Fed would reduce its short-term policy rate, maybe by more than the 50 bps currently expected in 2025.
Behavioral Finance Considerations
- There are still a lot of unknowns at this time. The short-term outlook is certainly creating a lot of anxiety for businesses and consumers alike. The initial tariffs and the haste in which they were implemented has eroded the confidence of a large number of market participants, as it is human nature to be fearful when the future looks so uncertain. It is important to note that the selloff seen in the days following the tariff announcement is not based on economic fundamentals or any hard data. Market prices are not currently reflecting expectations for consumer spending, expectations for corporate earnings and expectations for economic growth. Nobody can predict these variables with any confidence, based on the current facts and circumstances. Simply put, the market’s initial reaction has been primarily driven by psychological forces (i.e. “the fear of the unknown”). These are the same forces that would likely propel markets higher at the sign of any good news in the days and weeks ahead.
What Should Long-Term Investors Do?
- As always, long-term investors should stick to an investment strategy that aligns with their willingness and ability to take risk. If an investor has a long investment time horizon and is willing to take risk, the selloff in stock markets provides an opportunity to buy long-term investments at a discount to where prices were less than a week ago.
- Short-term investors (with liquidity needs of one year or less), on the other hand, should rarely have any material exposure to equity markets. Short-term investors that wish to have allocations to stocks do so at their own peril.
- It is also important for investors to remember the following:
- Higher levels of uncertainty lead to higher levels of volatility and deeper stock market declines.
- High levels of uncertainty are typically short lived. In early 2020, for example, COVID-19 created a level of uncertainty that the world rarely sees. For investors, this uncertainty lasted about three months. Stocks declined about 35% in less than a month before rebounding and finishing the year up close to 20%.
- It is impossible to time when markets will sell off and when markets will reverse course. Investors that stick to an investment strategy and avoid changing that strategy based on short-term considerations, are most able to grow their wealth over the long term.
Economic Forecasts
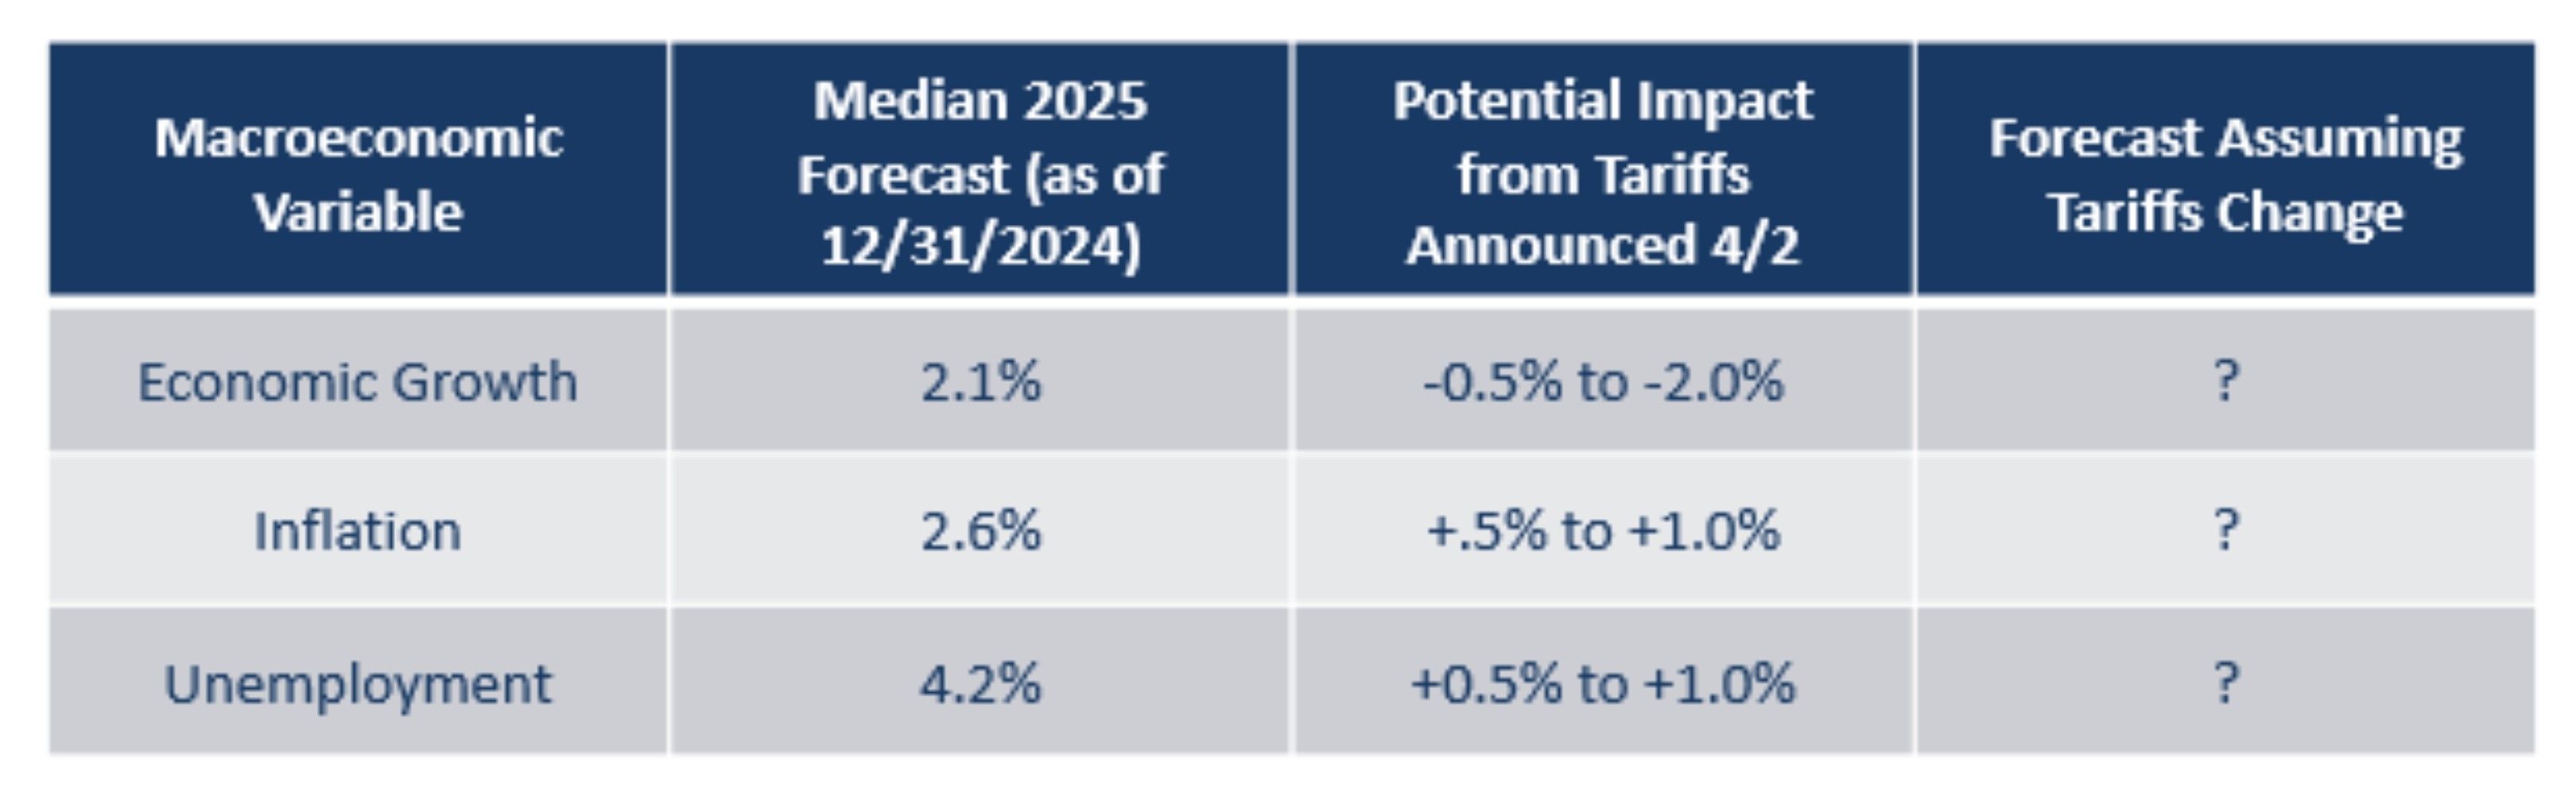
- The table above shows:
- The calendar year forecasts as of 12/31/2024.
- Potential change to the original macroeconomic forecasts (assuming the announced tariffs stay in place for the full year).
- Economic forecasts are in flux right now due to all of the uncertainty. As stated earlier, with the complexity of global trade and likely negotiations taking place in the coming days and weeks, it is very difficult to predict what the final outcomes will be.
2025 Potential Policy Changes
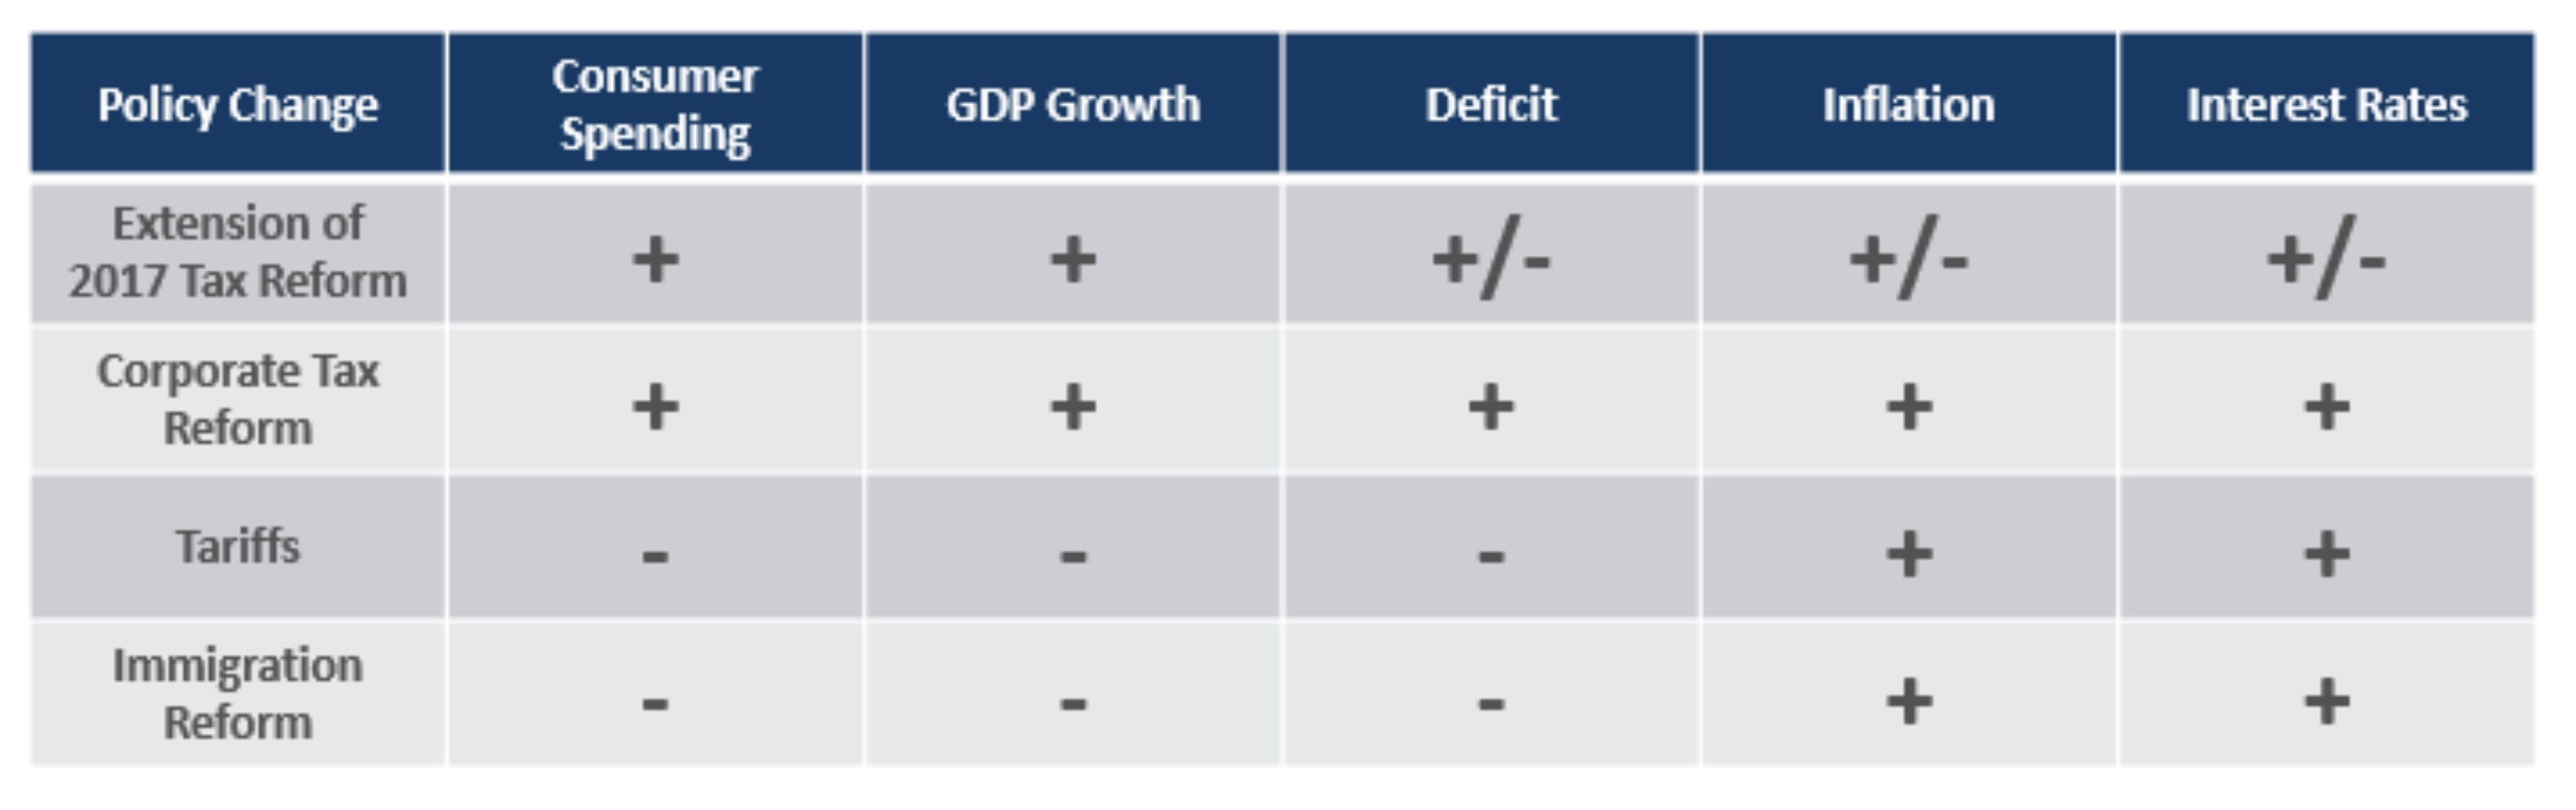
- The table highlights the impact certain policy changes may have on selected U.S. macroeconomic variables in 2025.
- Certain policy changes are expected to have more meaningful or longer lasting impacts on the macroeconomy than others.
- Consumer sentiment waned in the first quarter as an uptick in inflation, coupled with decreased consumer spending, contributed to slowing economic growth.
- The changing news flow surrounding tariffs has led to increased market volatility. Reciprocal tariff rates, announced in early April, were higher than the market was anticipating.
- While it is too early to know with certainty how countries will respond to the tariffs announced, the risk of a trade war has increased.
- While we do not expect the U.S. to fall into recession – the revenue from tariffs are expected to be distributed back into the economy – the risk has certainly increased.
- Takeaways:
- Current policy changes – whether proposed or implemented – are not necessarily firm as the situation remains fluid with shifts altering the landscape regularly.
- Overall, even with the negative ramifications striking first, the proposed policy changes are unlikely to change the long-term trajectory of U.S. economic growth in a meaningful way.
- With companies and consumers treading cautiously of late, it is possible that they will both prove to be more adaptable than they are currently being given credit for.
2025 Potential Policy Changes: Corporate Income Tax Reform
- U.S. corporate income tax reform could help boost corporate earnings over the short term, but the impact of the proposed tax cuts would be rather limited compared to the tax cuts enacted in 2018 when corporate income tax rates were cut from 35% to 21%.
- Current proposed changes to corporate income tax code includes lowering income tax rates from 21% to 15%, but the benefit may only apply to firms that produce goods in the U.S.
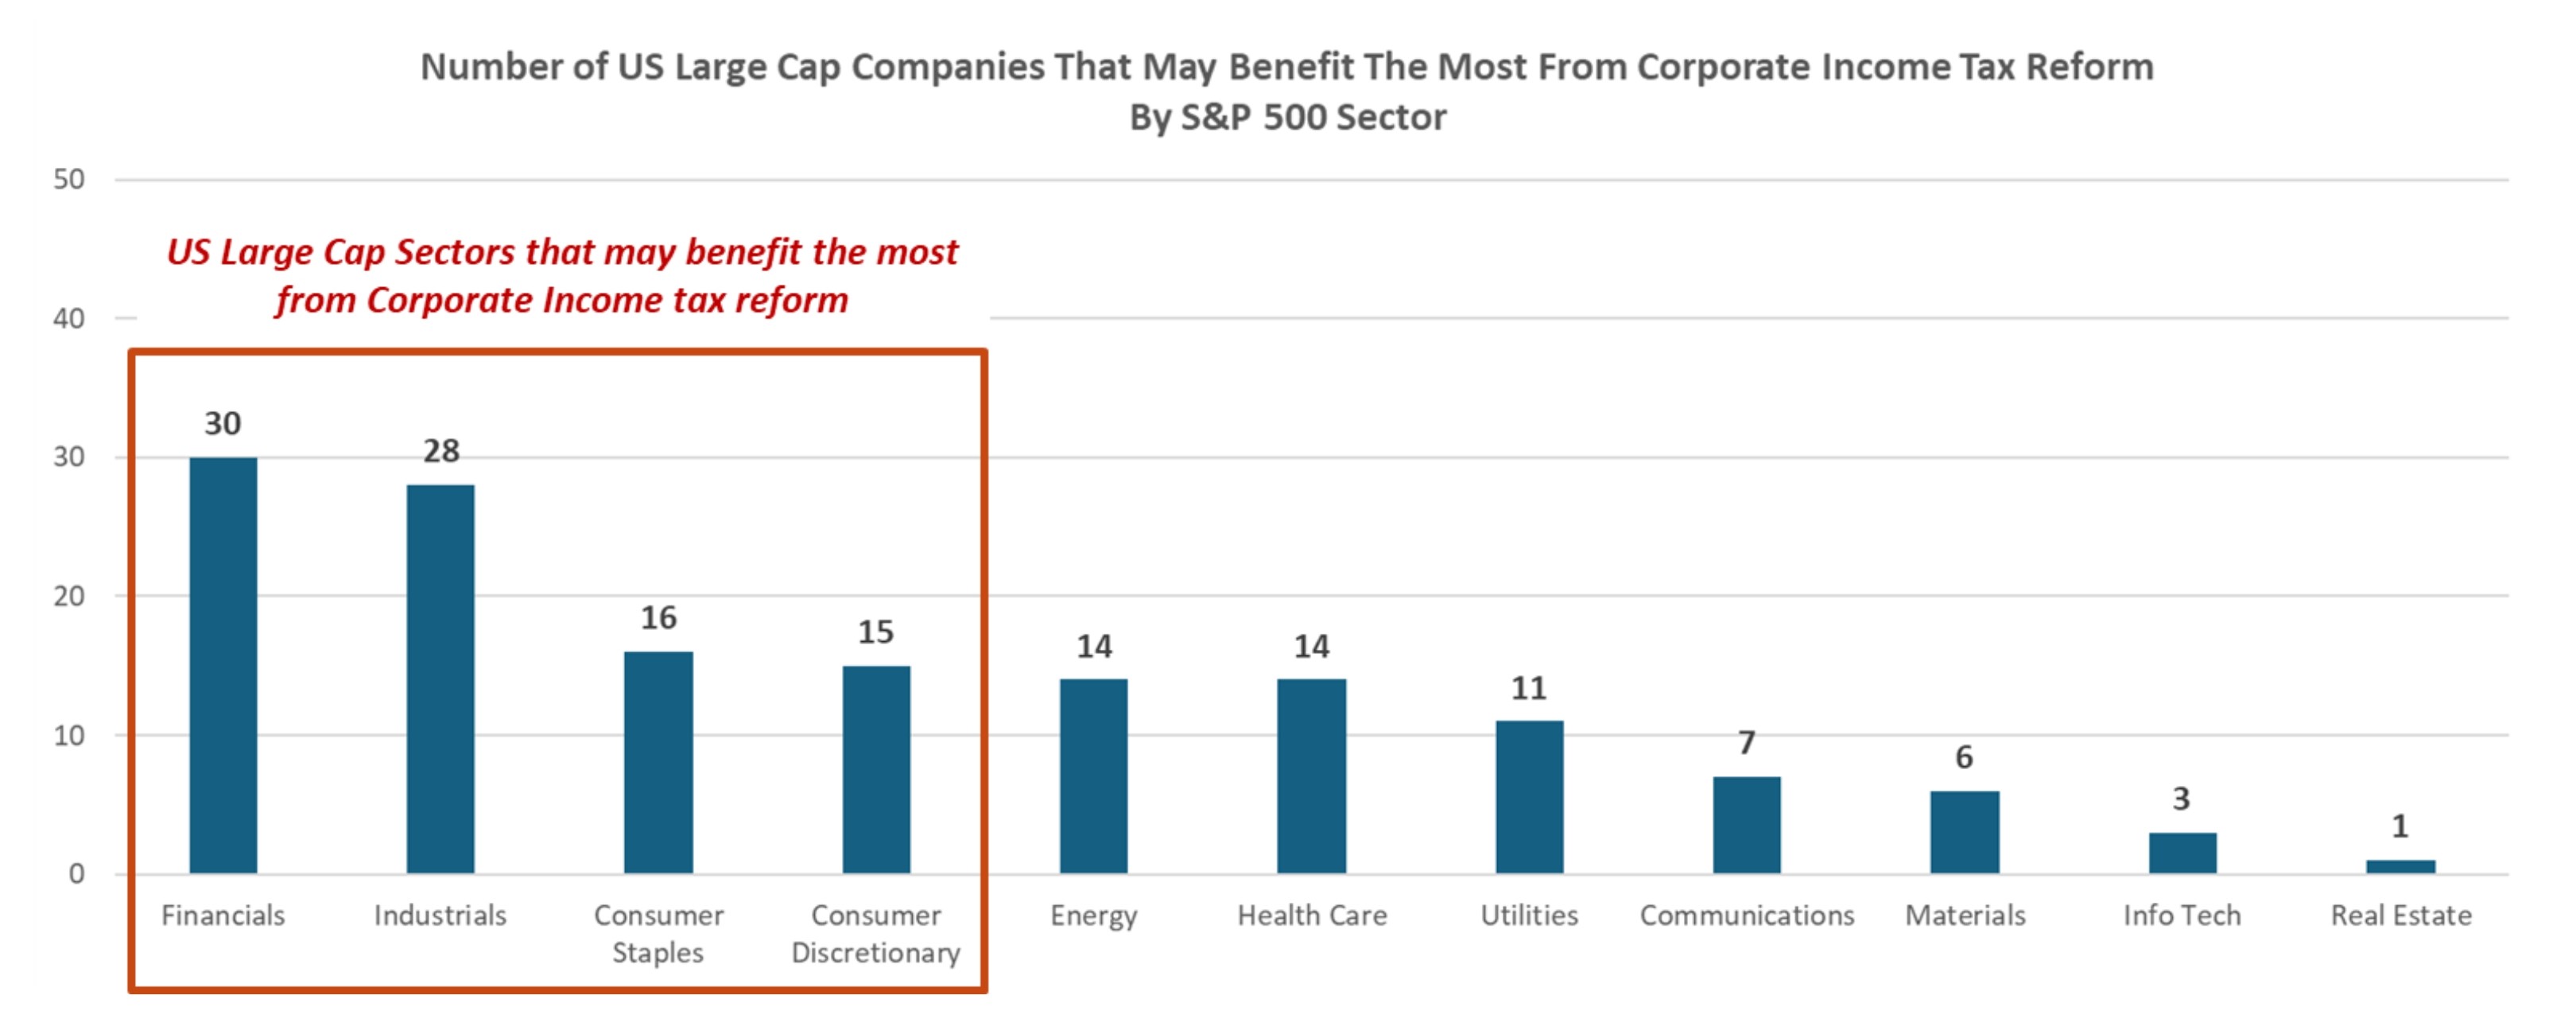
- Firms that pay higher effective income tax rates (ex: above 15%) and produce more than 80% of annual revenue in the U.S. stand to benefit the most. Firms that generate more revenue overseas (or already have low effective tax rates) may not benefit.
- Takeaway:
- Firms within Financials, Industrials, Consumer Staples and Consumer Discretionary may benefit the most from corporate income tax reform.
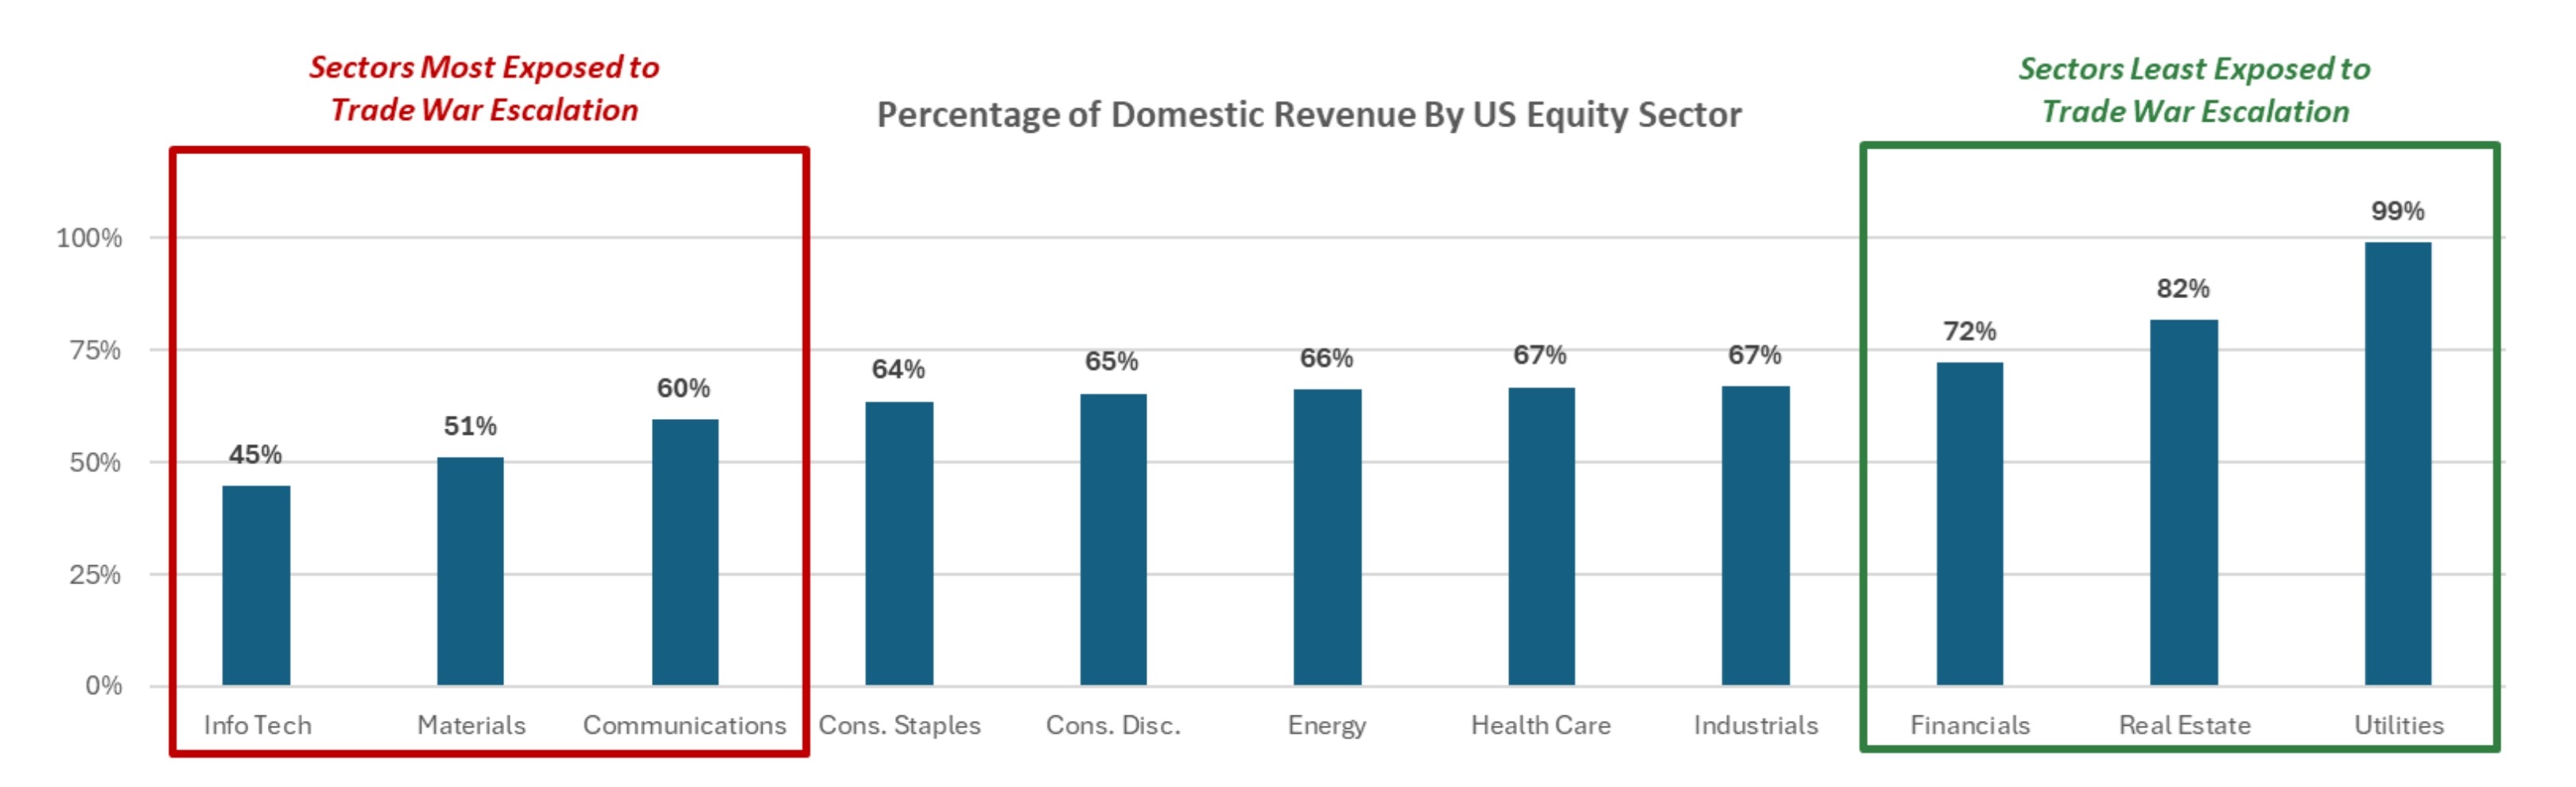
- An escalating trade war is not “good” for any U.S. equity sector, but certain sectors are less exposed to trade protectionism than others.
- U.S. equity sectors that have a relatively high percentage of revenue generated domestically are less impacted by trade war escalation.
- U.S. equity sectors that have a relatively high percentage of revenue generated overseas are more impacted by trade war escalation.
- Takeaways:
- Financials, Real Estate and Utilities sectors will be impacted the least, should trade protectionism escalate.
- Info Tech, Materials and Communications sectors have the most to lose, should trade protectionism escalate.
Equity Valuations
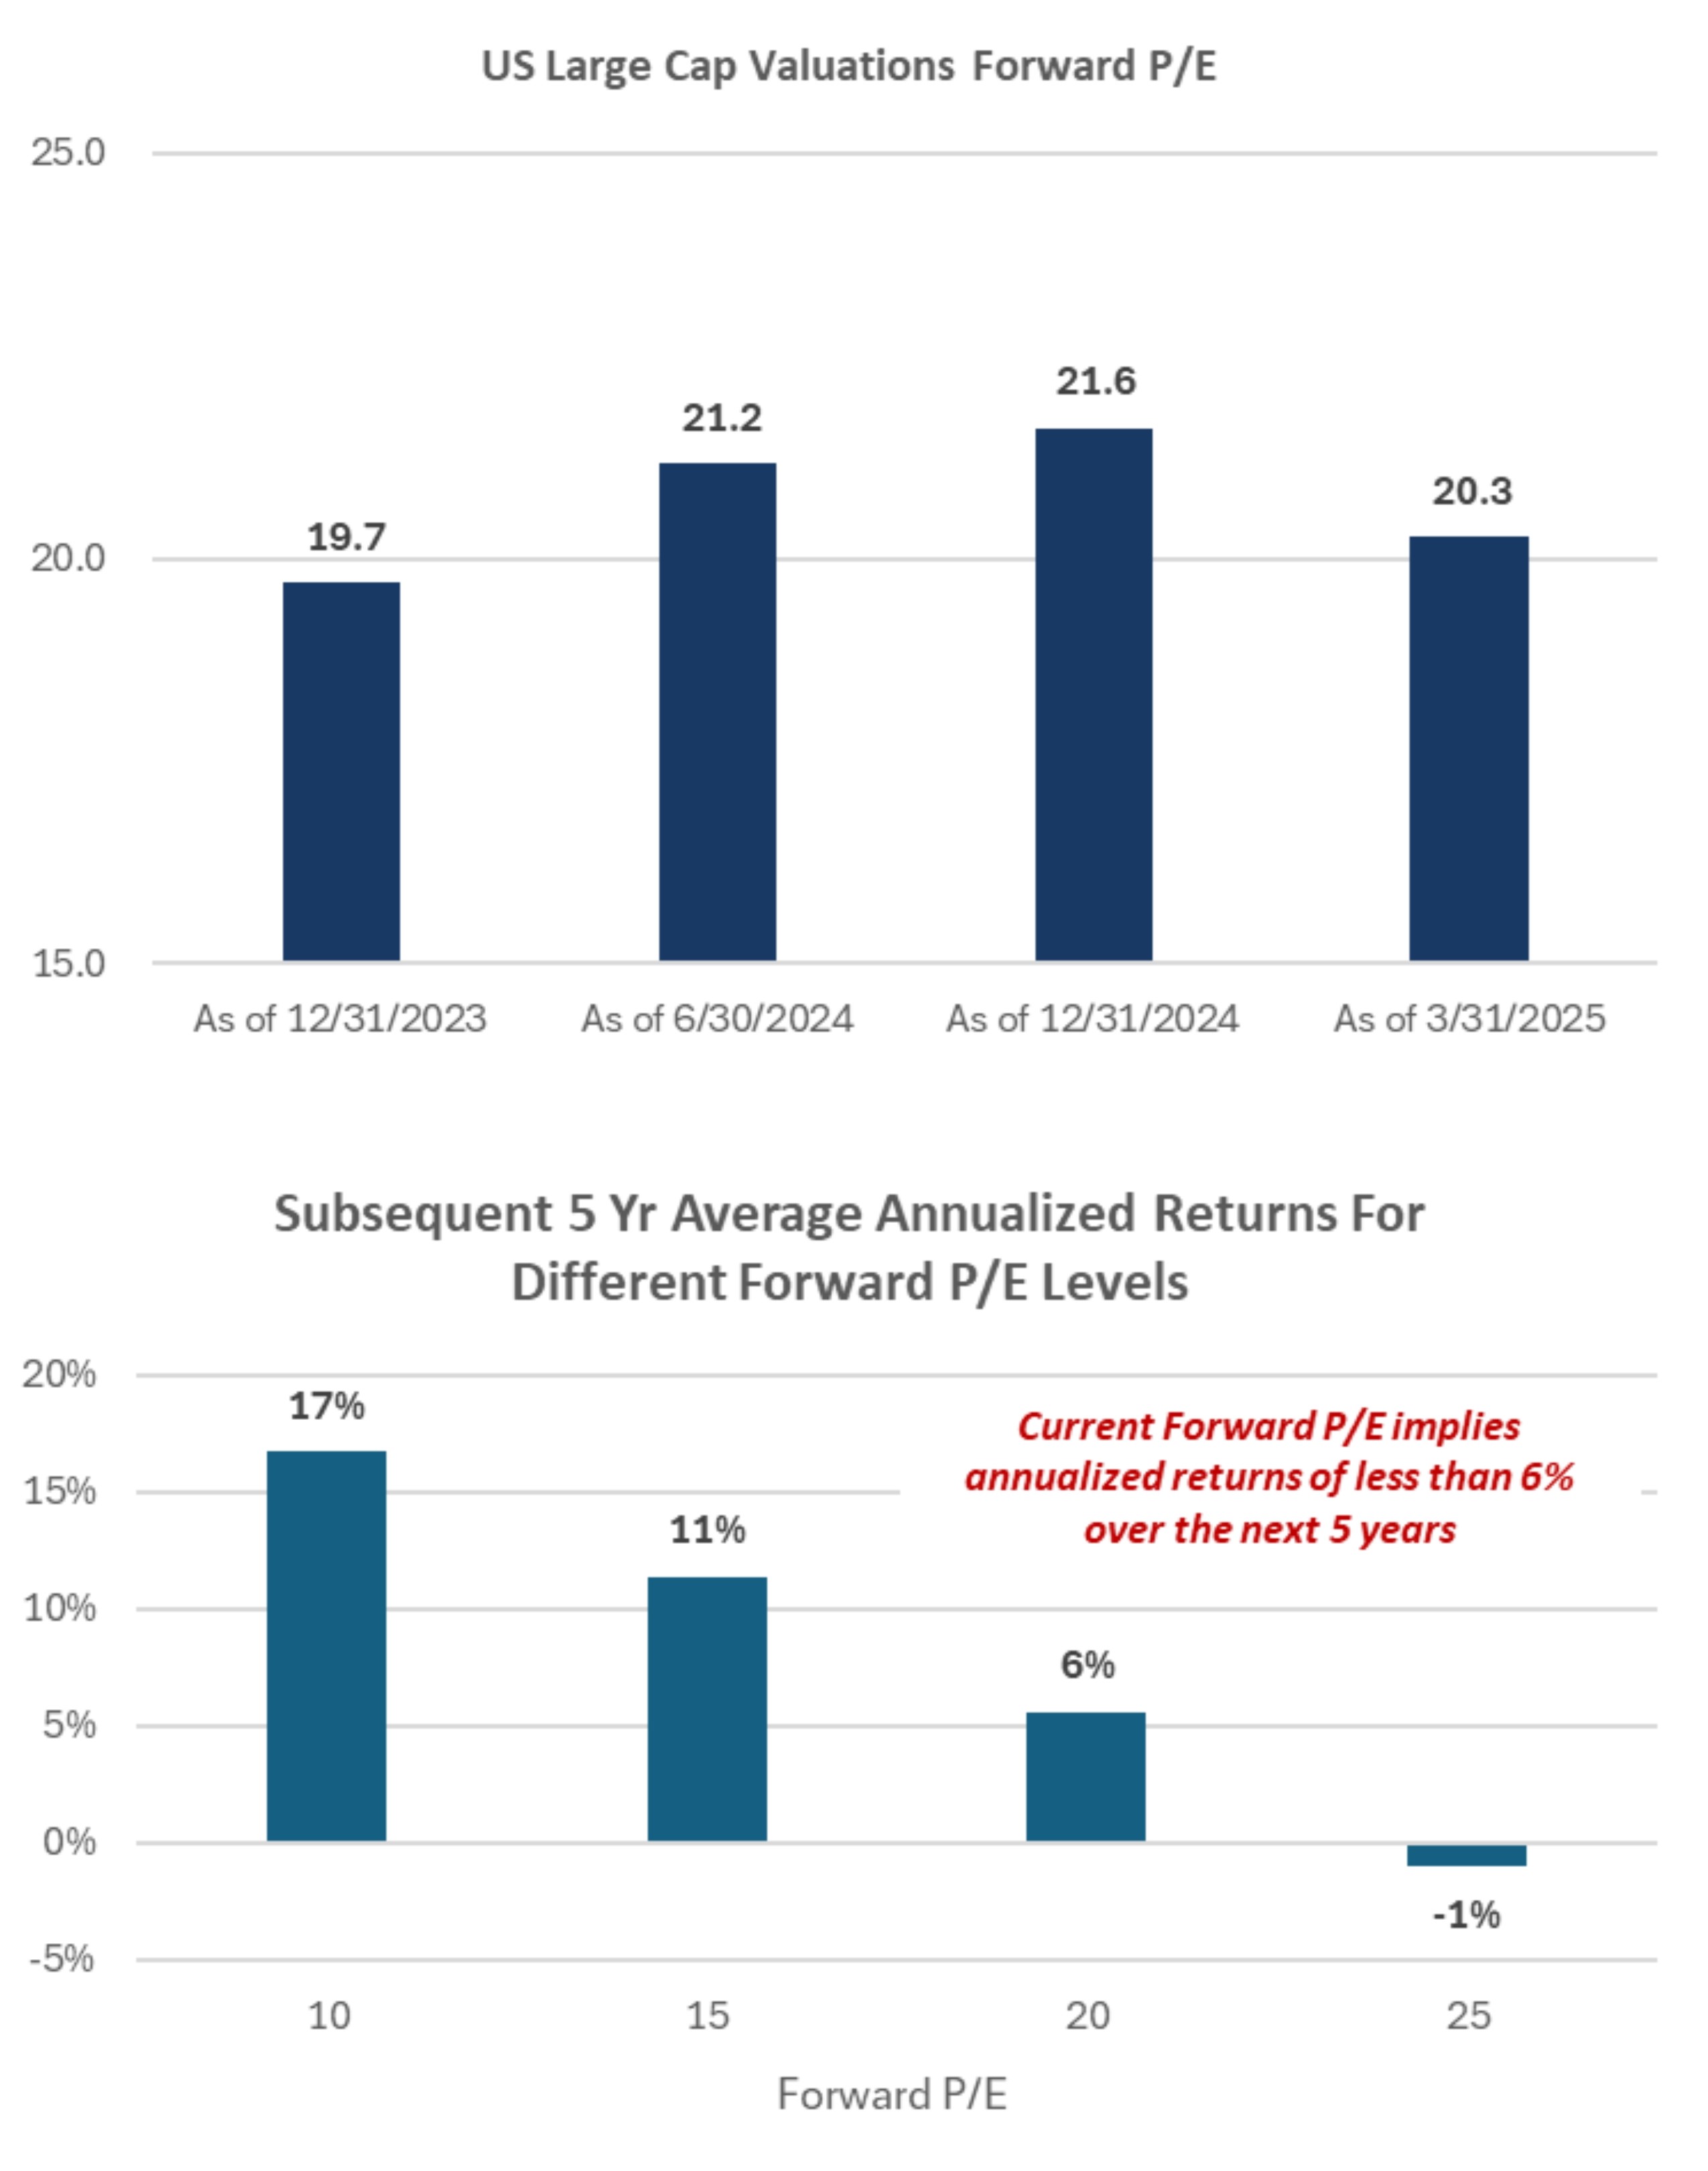
- U.S. Large Cap equity valuations have come in significantly over the last quarter. Despite this, valuations are still relative “expensive” compared to historical norms.
- Ex: U.S. Large Cap Forward P/E is currently 20.3, which is 23% higher than the long-term (30 year) average Forward P/E.
- Other fundamental valuation metrics (Forward P/B, Forward P/S, etc.) also indicate that U.S. Large Cap stocks are “expensive” compared to historical observations.
- Higher-than-average equity valuations have historically led to lower equity returns in subsequent years.
- When U.S. Large Cap stocks are “very cheap,” annualized returns in the following five years have averaged 17%.
- When U.S. Large Cap stocks are “very expensive,” annualized returns in the following five years have averaged -1%.
- Takeaways:
- Investors should be mindful of the fact that high valuations historically have led to lower future returns.
- U.S. Large Cap stocks may underperform lower valuation asset classes (ex: U.S. Small Cap) as long as the U.S. economy continues to grow.
Relative Valuations: U.S. Large Cap Comparison
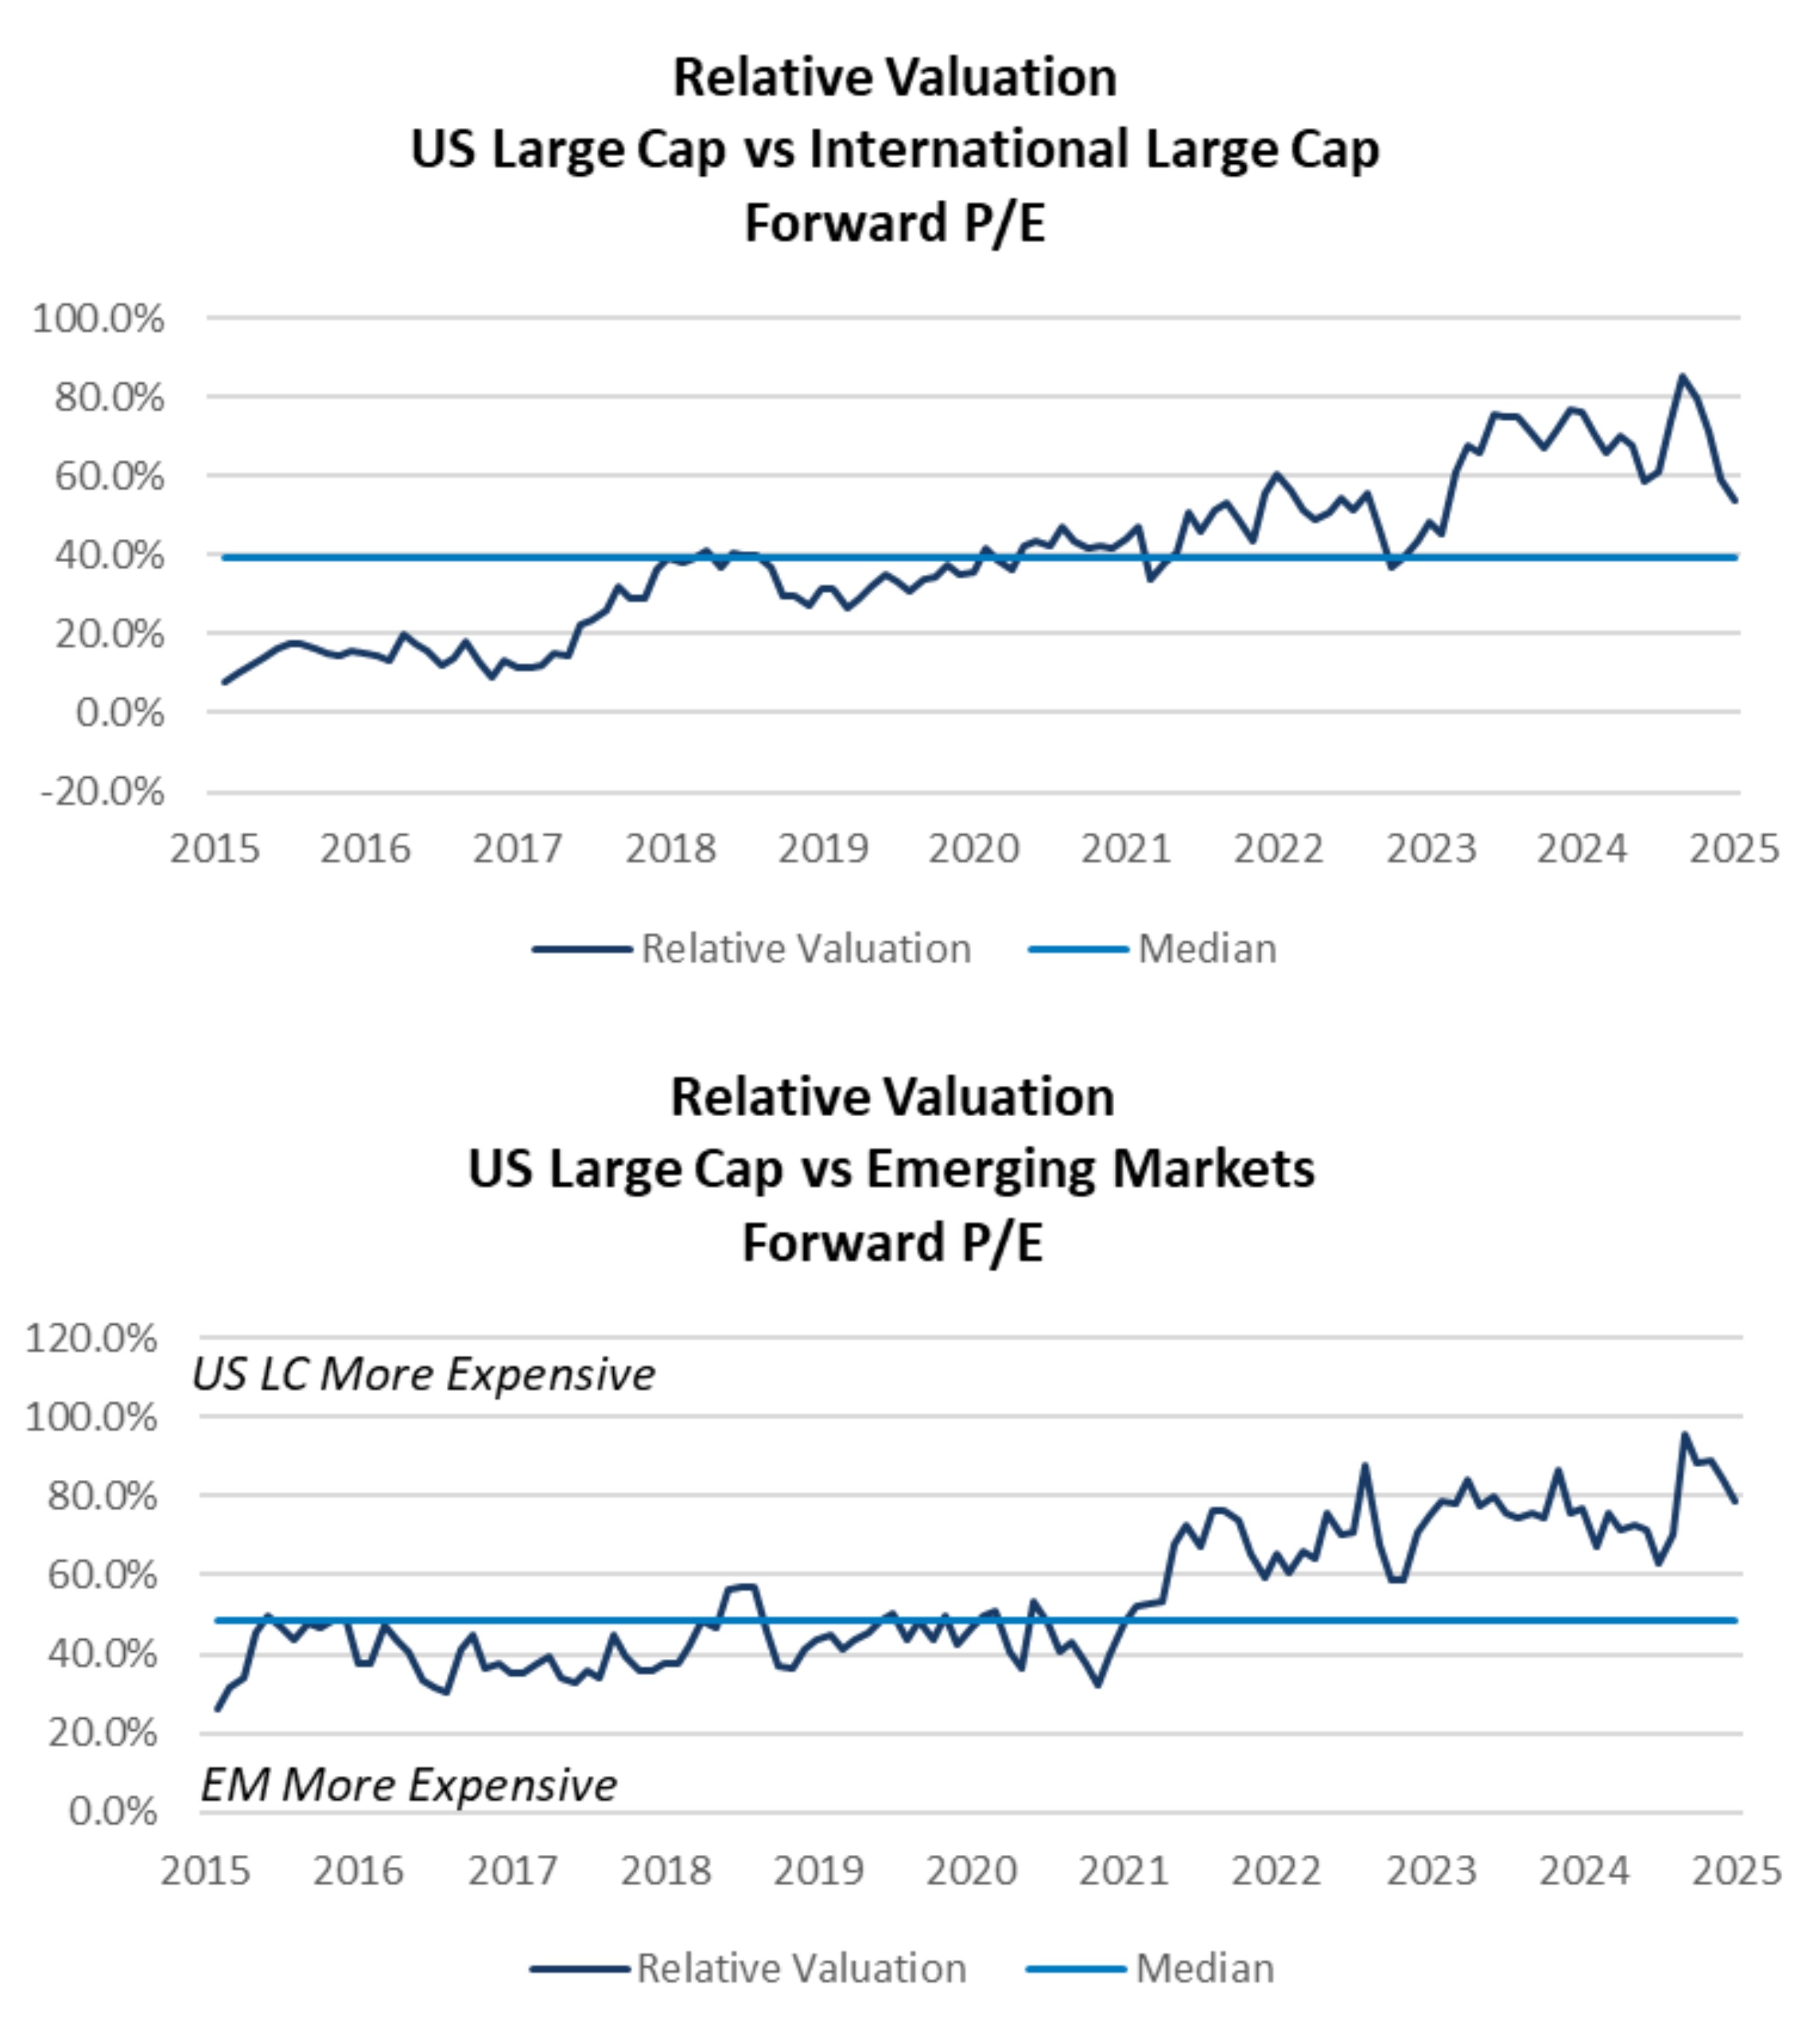
- Despite recent outperformance by equities outside the U.S., fundamental valuation metrics suggest that U.S. equities are still “expensive” on a relative basis.
- Relative valuations for U.S. Large Cap stocks have come down of late but remain above their 10-year average.
- International and emerging market equities rallied to start the year, while U.S. Large Caps have struggled, helping to close the valuation gap.
- Economic consideration:
- Amidst widespread uncertainty, international markets are expected to face a harsher impact in regards to tariffs and trade wars than U.S. stocks.
- Takeaway:
- A slight underweight to International Equity and Emerging Market equity is recommended, given the potential for trade related volatility is expected to continue in 2025.
Relative Valuations: Growth vs. Value Comparison
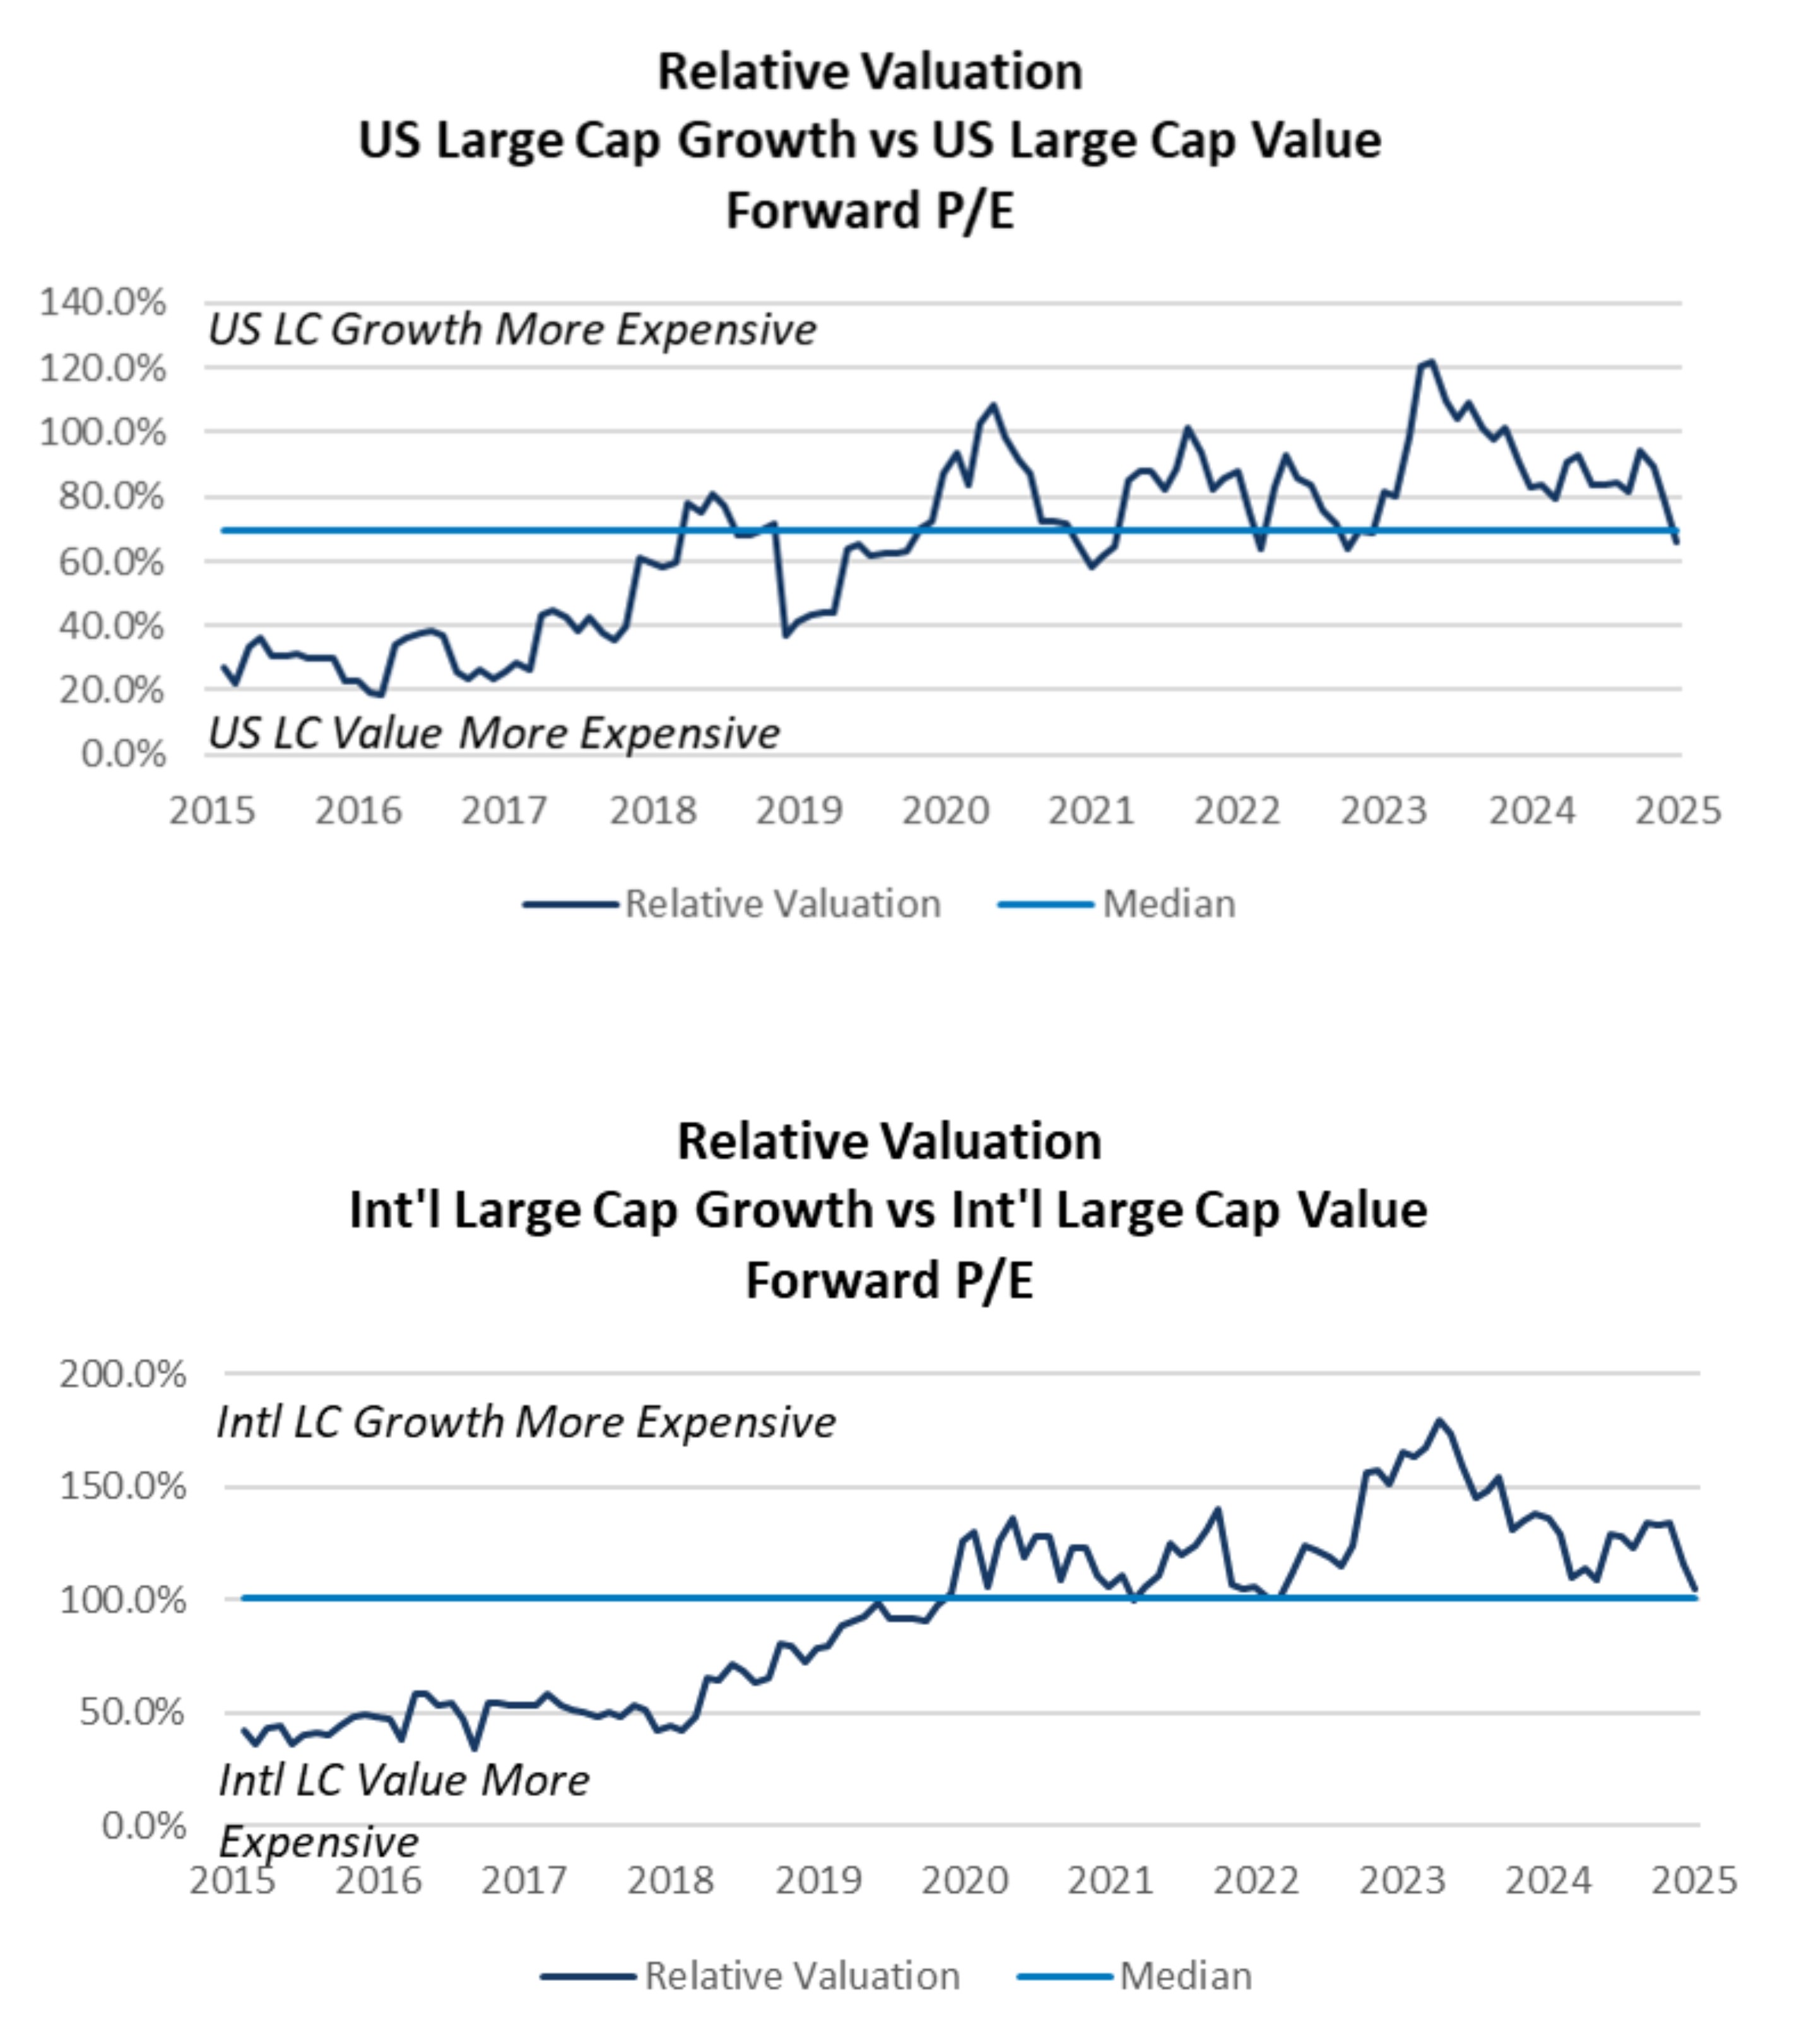
- A healthy rotation out of “Growth” equities and into less expensive “Value” equities took place during the quarter, which brought their relative fundamental valuation metrics closer inline with the 10-year average.
- Economic considerations:
- “Value” equities carry less risk than “Growth” equities and have less downside exposure should market volatility increase.
- Value stocks also tend to have less downside exposure to trade and tariff related volatility than Growth stocks.
- Takeaway:
- A slight overweight to “Value” relative to “Growth” is recommended given current fundamental valuations and the potential for trade related volatility to continue.
Fixed Income: Treasuries
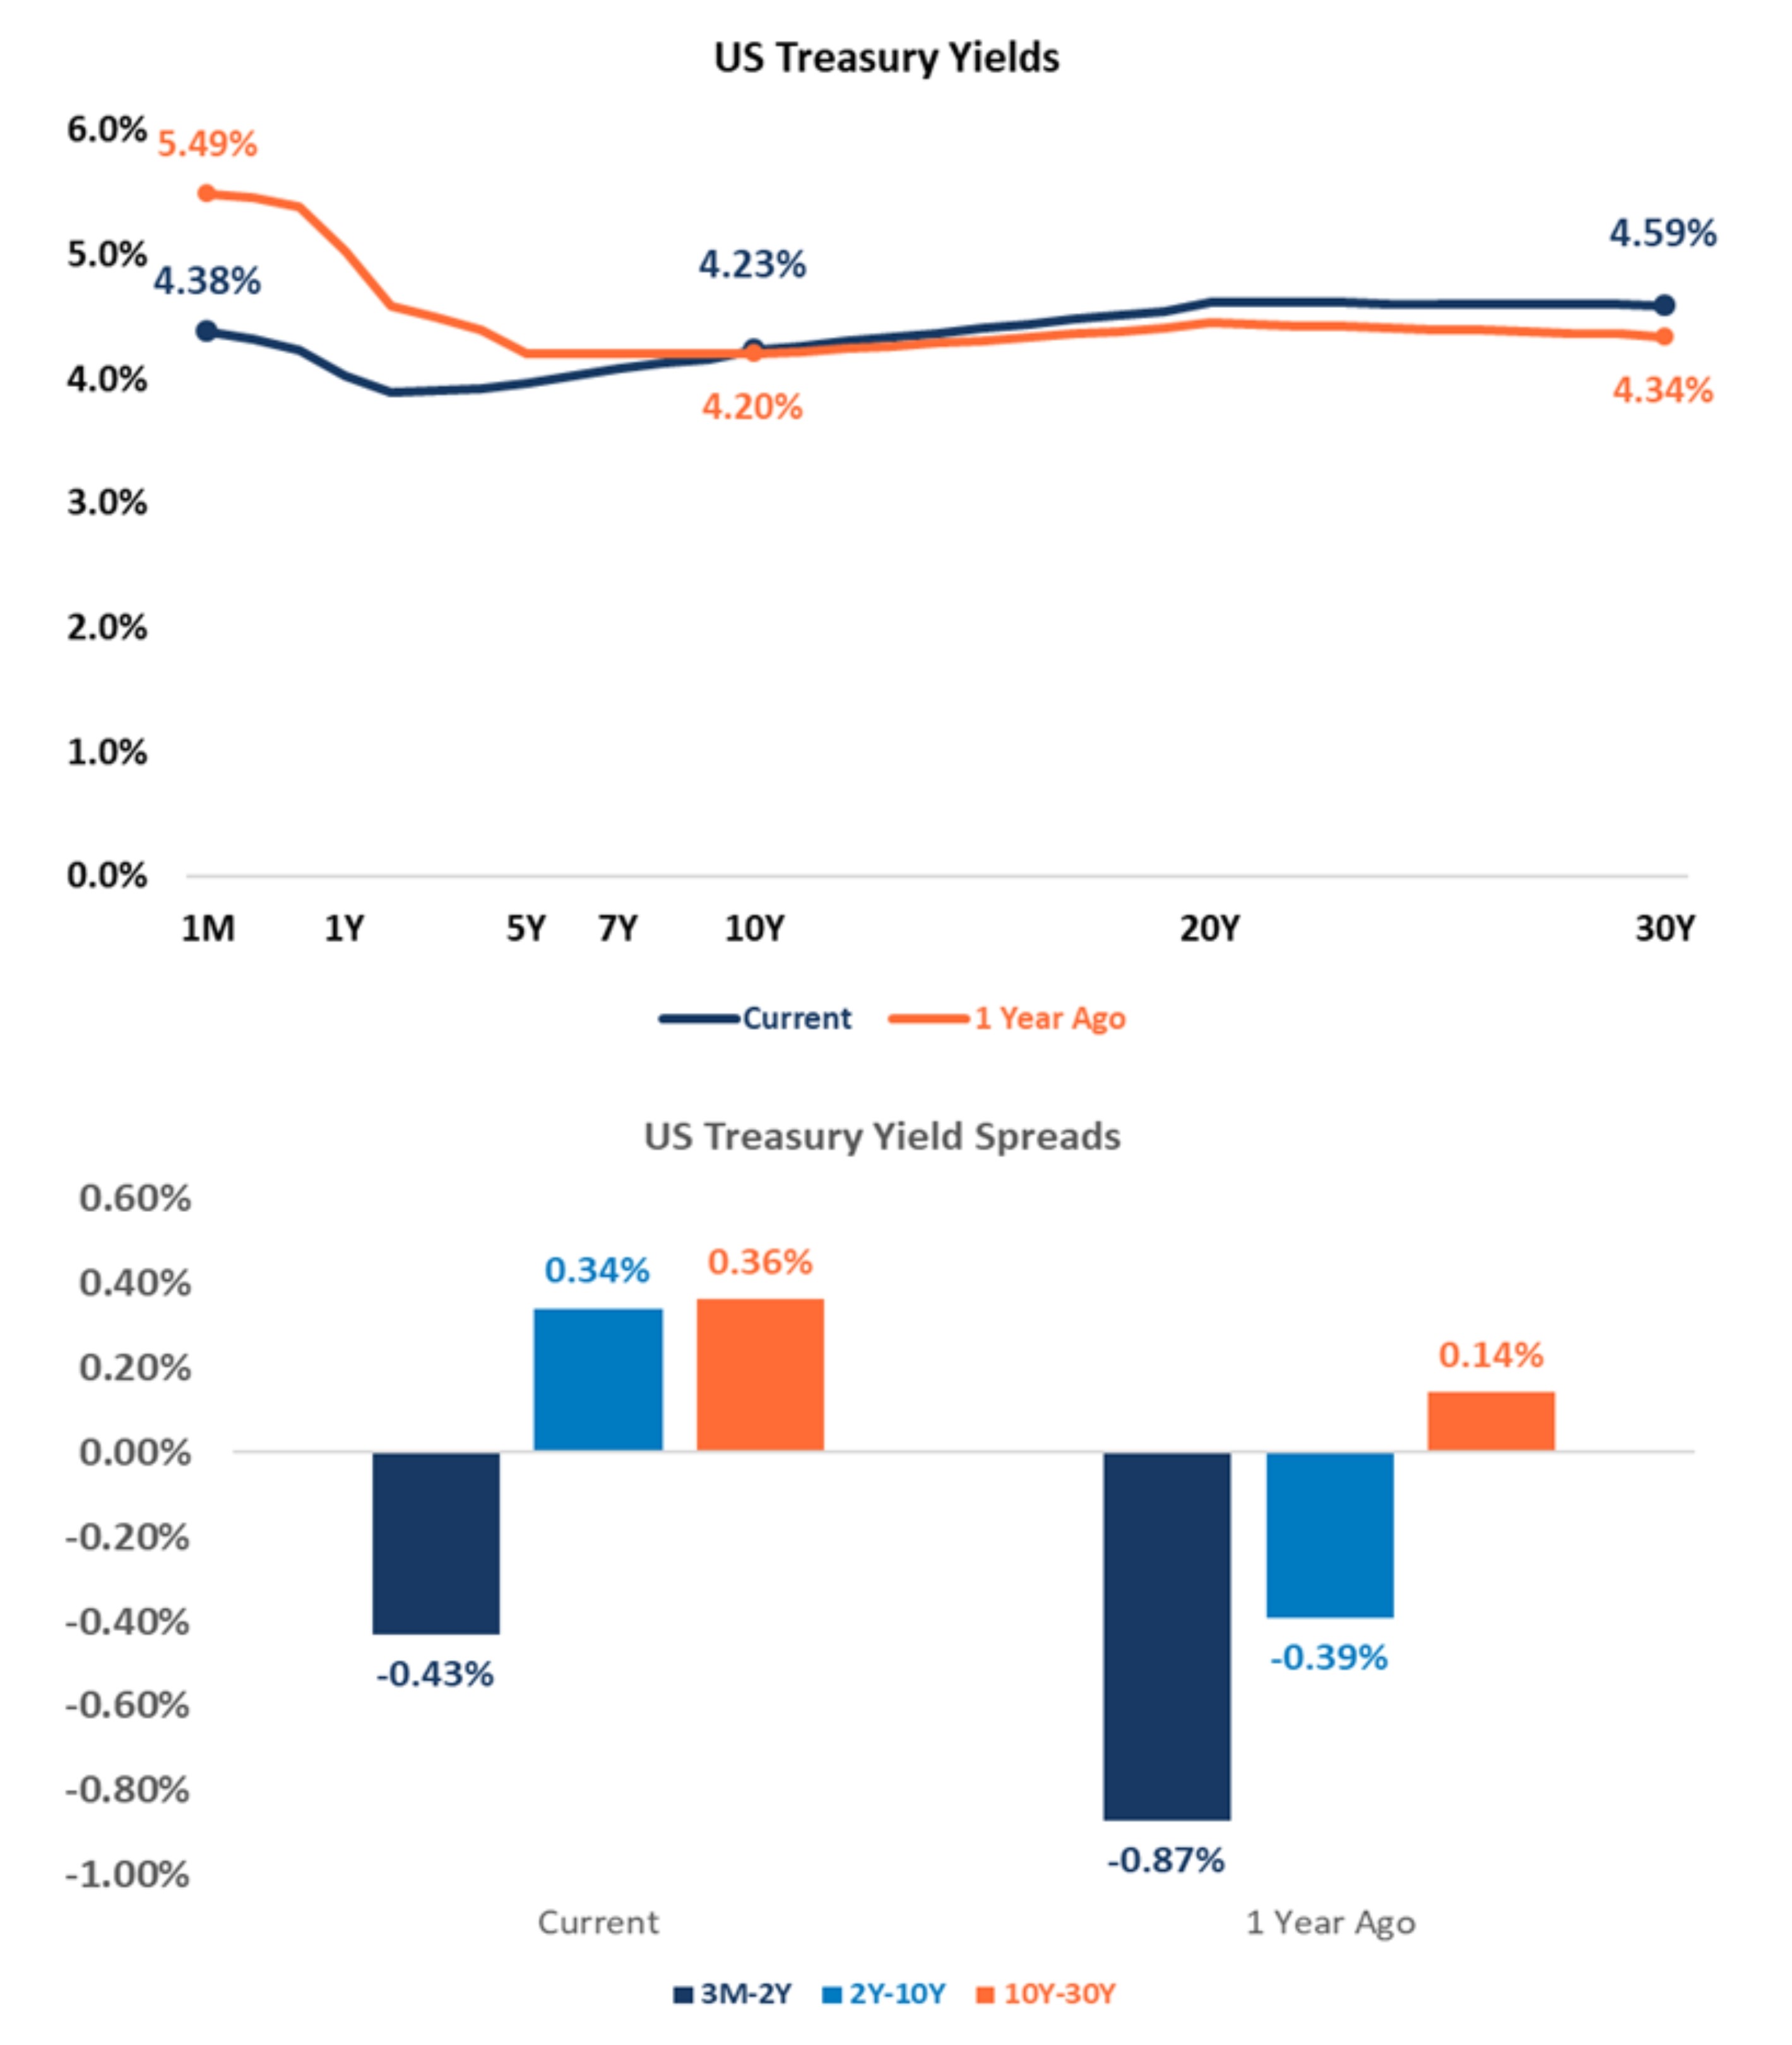
- The U.S. Treasury Yield curve has changed materially over the past year.
- The yield curve remains inverted only at the very short end of the curve, but longer-dated term rates are no longer inverted.
- Short-term yields declined by more than 1% because of Fed interest rate cuts over the past year.
- Longer-term yields moved higher on concerns of economic uncertainty, including inflation, growing U.S. deficits and trade wars.
- The yield curve remains inverted only at the very short end of the curve, but longer-dated term rates are no longer inverted.
- The yield curve should continue to steepen over the rest of 2025 as the Fed is expected to cut short-term rates by 0.25% during the year.
- Note: The Fed could elect to keep short-term rates unchanged should inflation remain stickier-than-expected (and unemployment does not increase materially).
- Takeaway:
- Investors should consider maintaining a short duration posture in their fixed income portfolios until the U.S. Treasury curve steepens more meaningfully.
Long-Term Investors Should Stay Invested
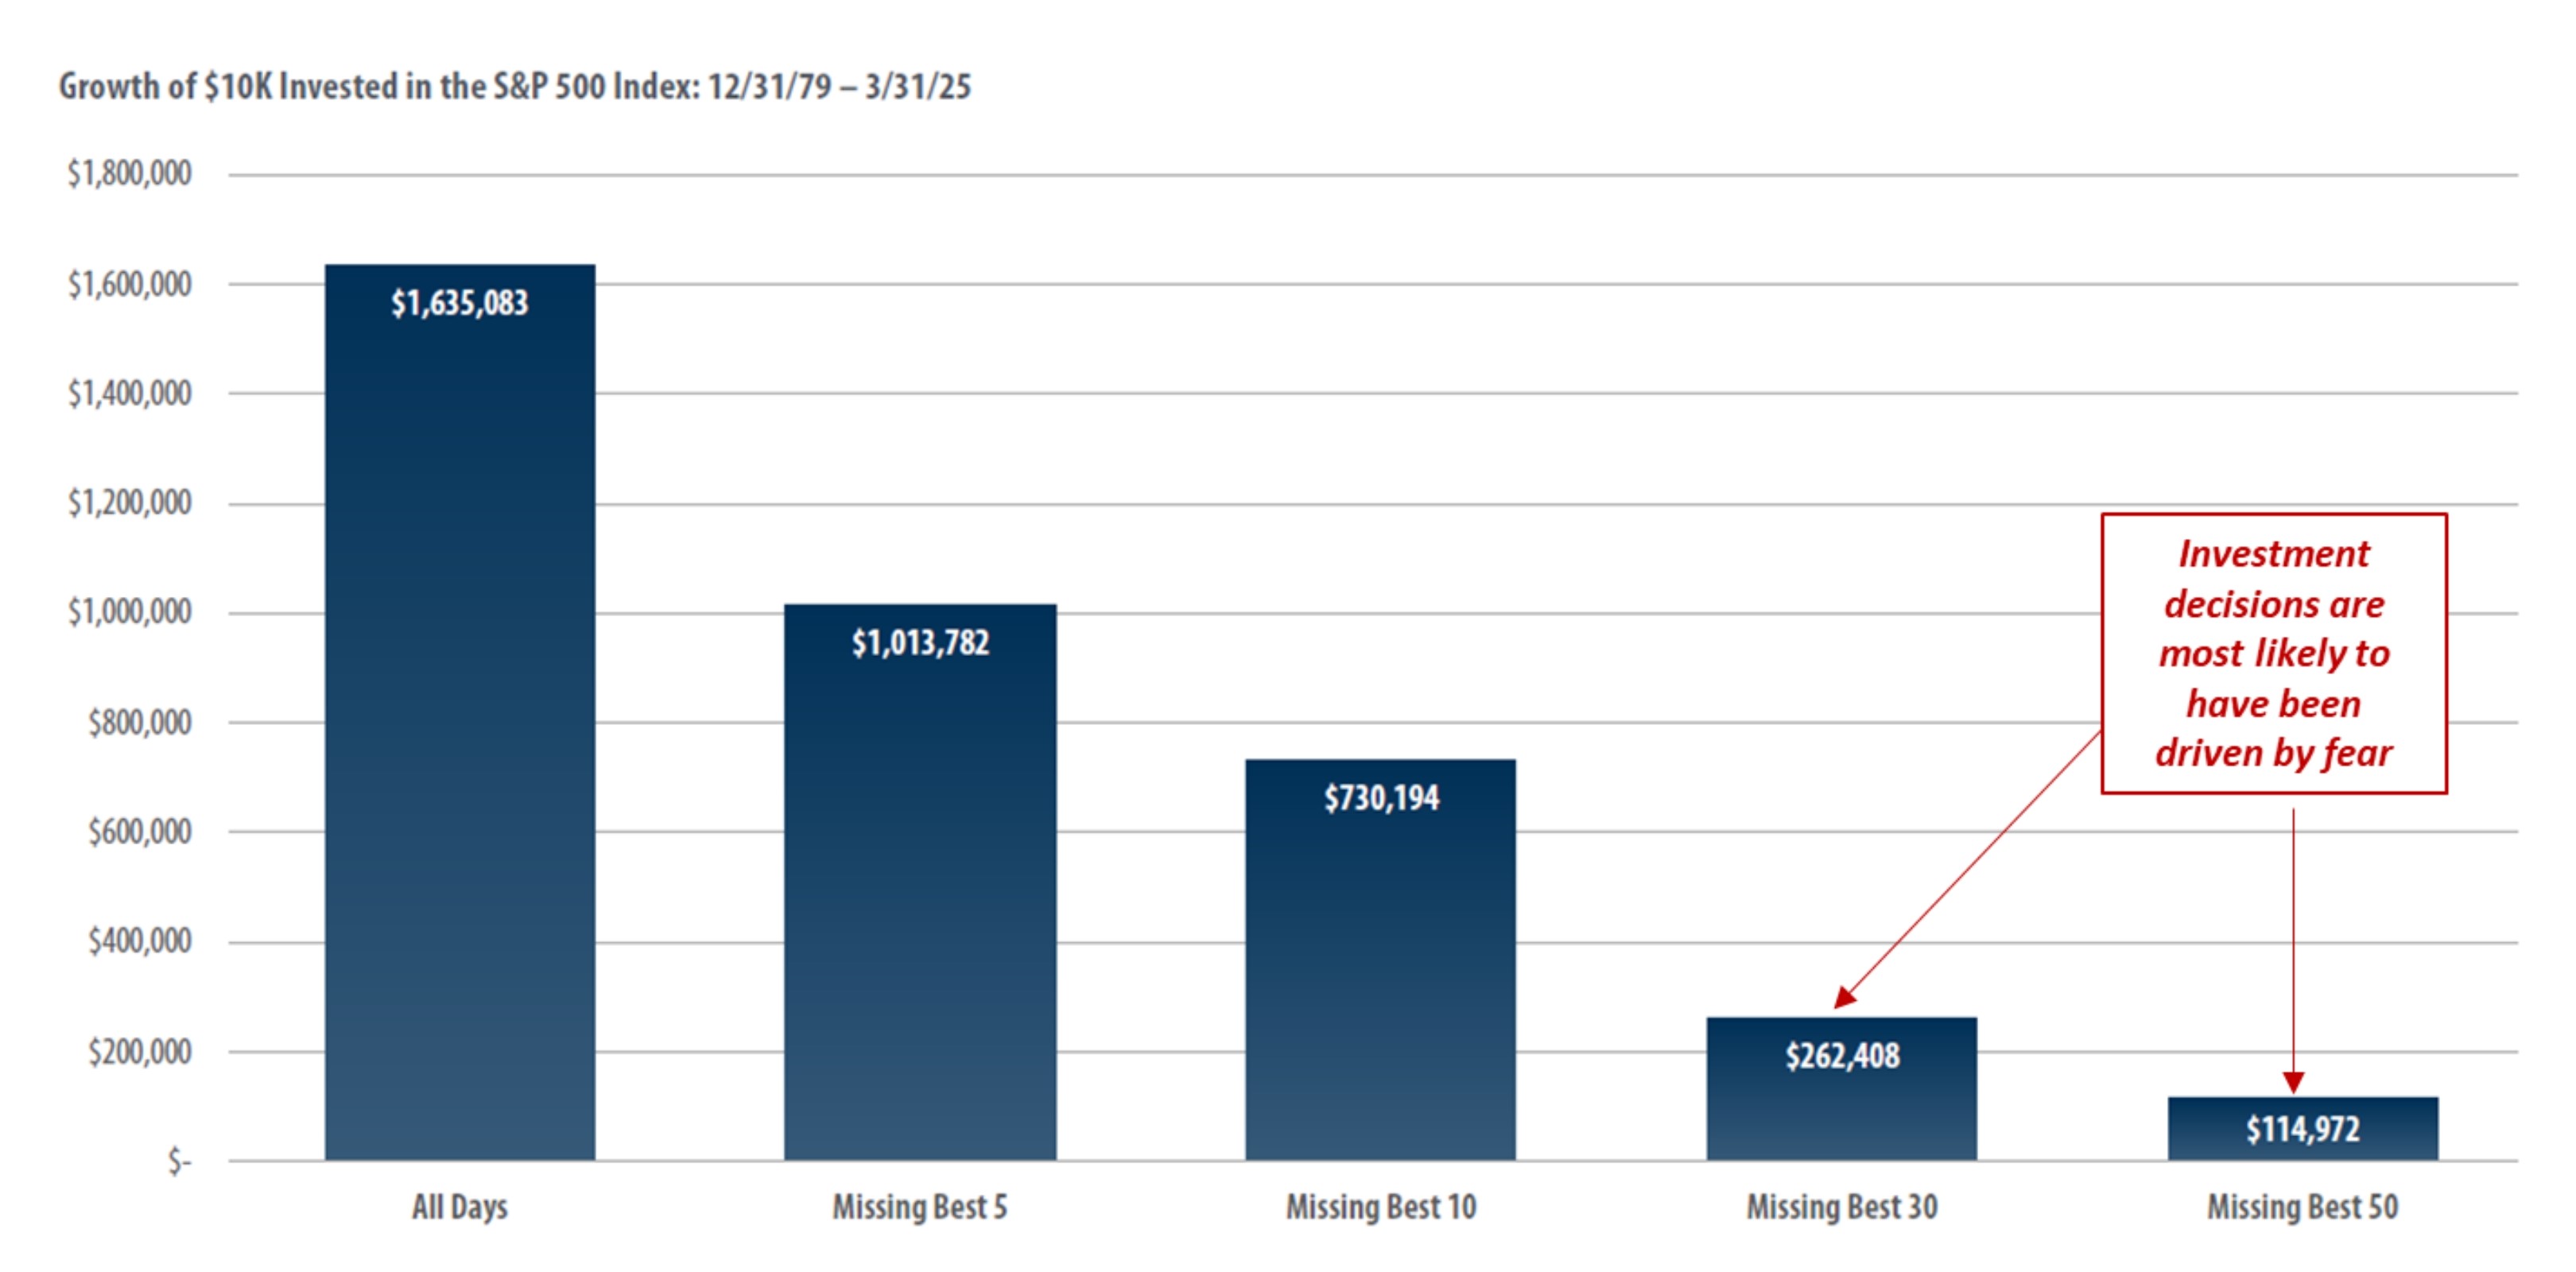
- The chart highlights how a $10k investment in the S&P 500 would have grown over the past 45 years.
- If the investor missed the best 30 days of market performance, the investment portfolio would be worth more than $1.3M less than if the investor had stayed in the market.
- Takeaways:
- The market’s best performance days typically occur during periods of elevated volatility.
- Regardless of what may be in store for the macroeconomy and capital markets, long-term investors should avoid the temptation to exit out of markets during periods of elevated uncertainty.
- Riding out market volatility is the best way to build wealth over the long term.
Equity Market Volatility
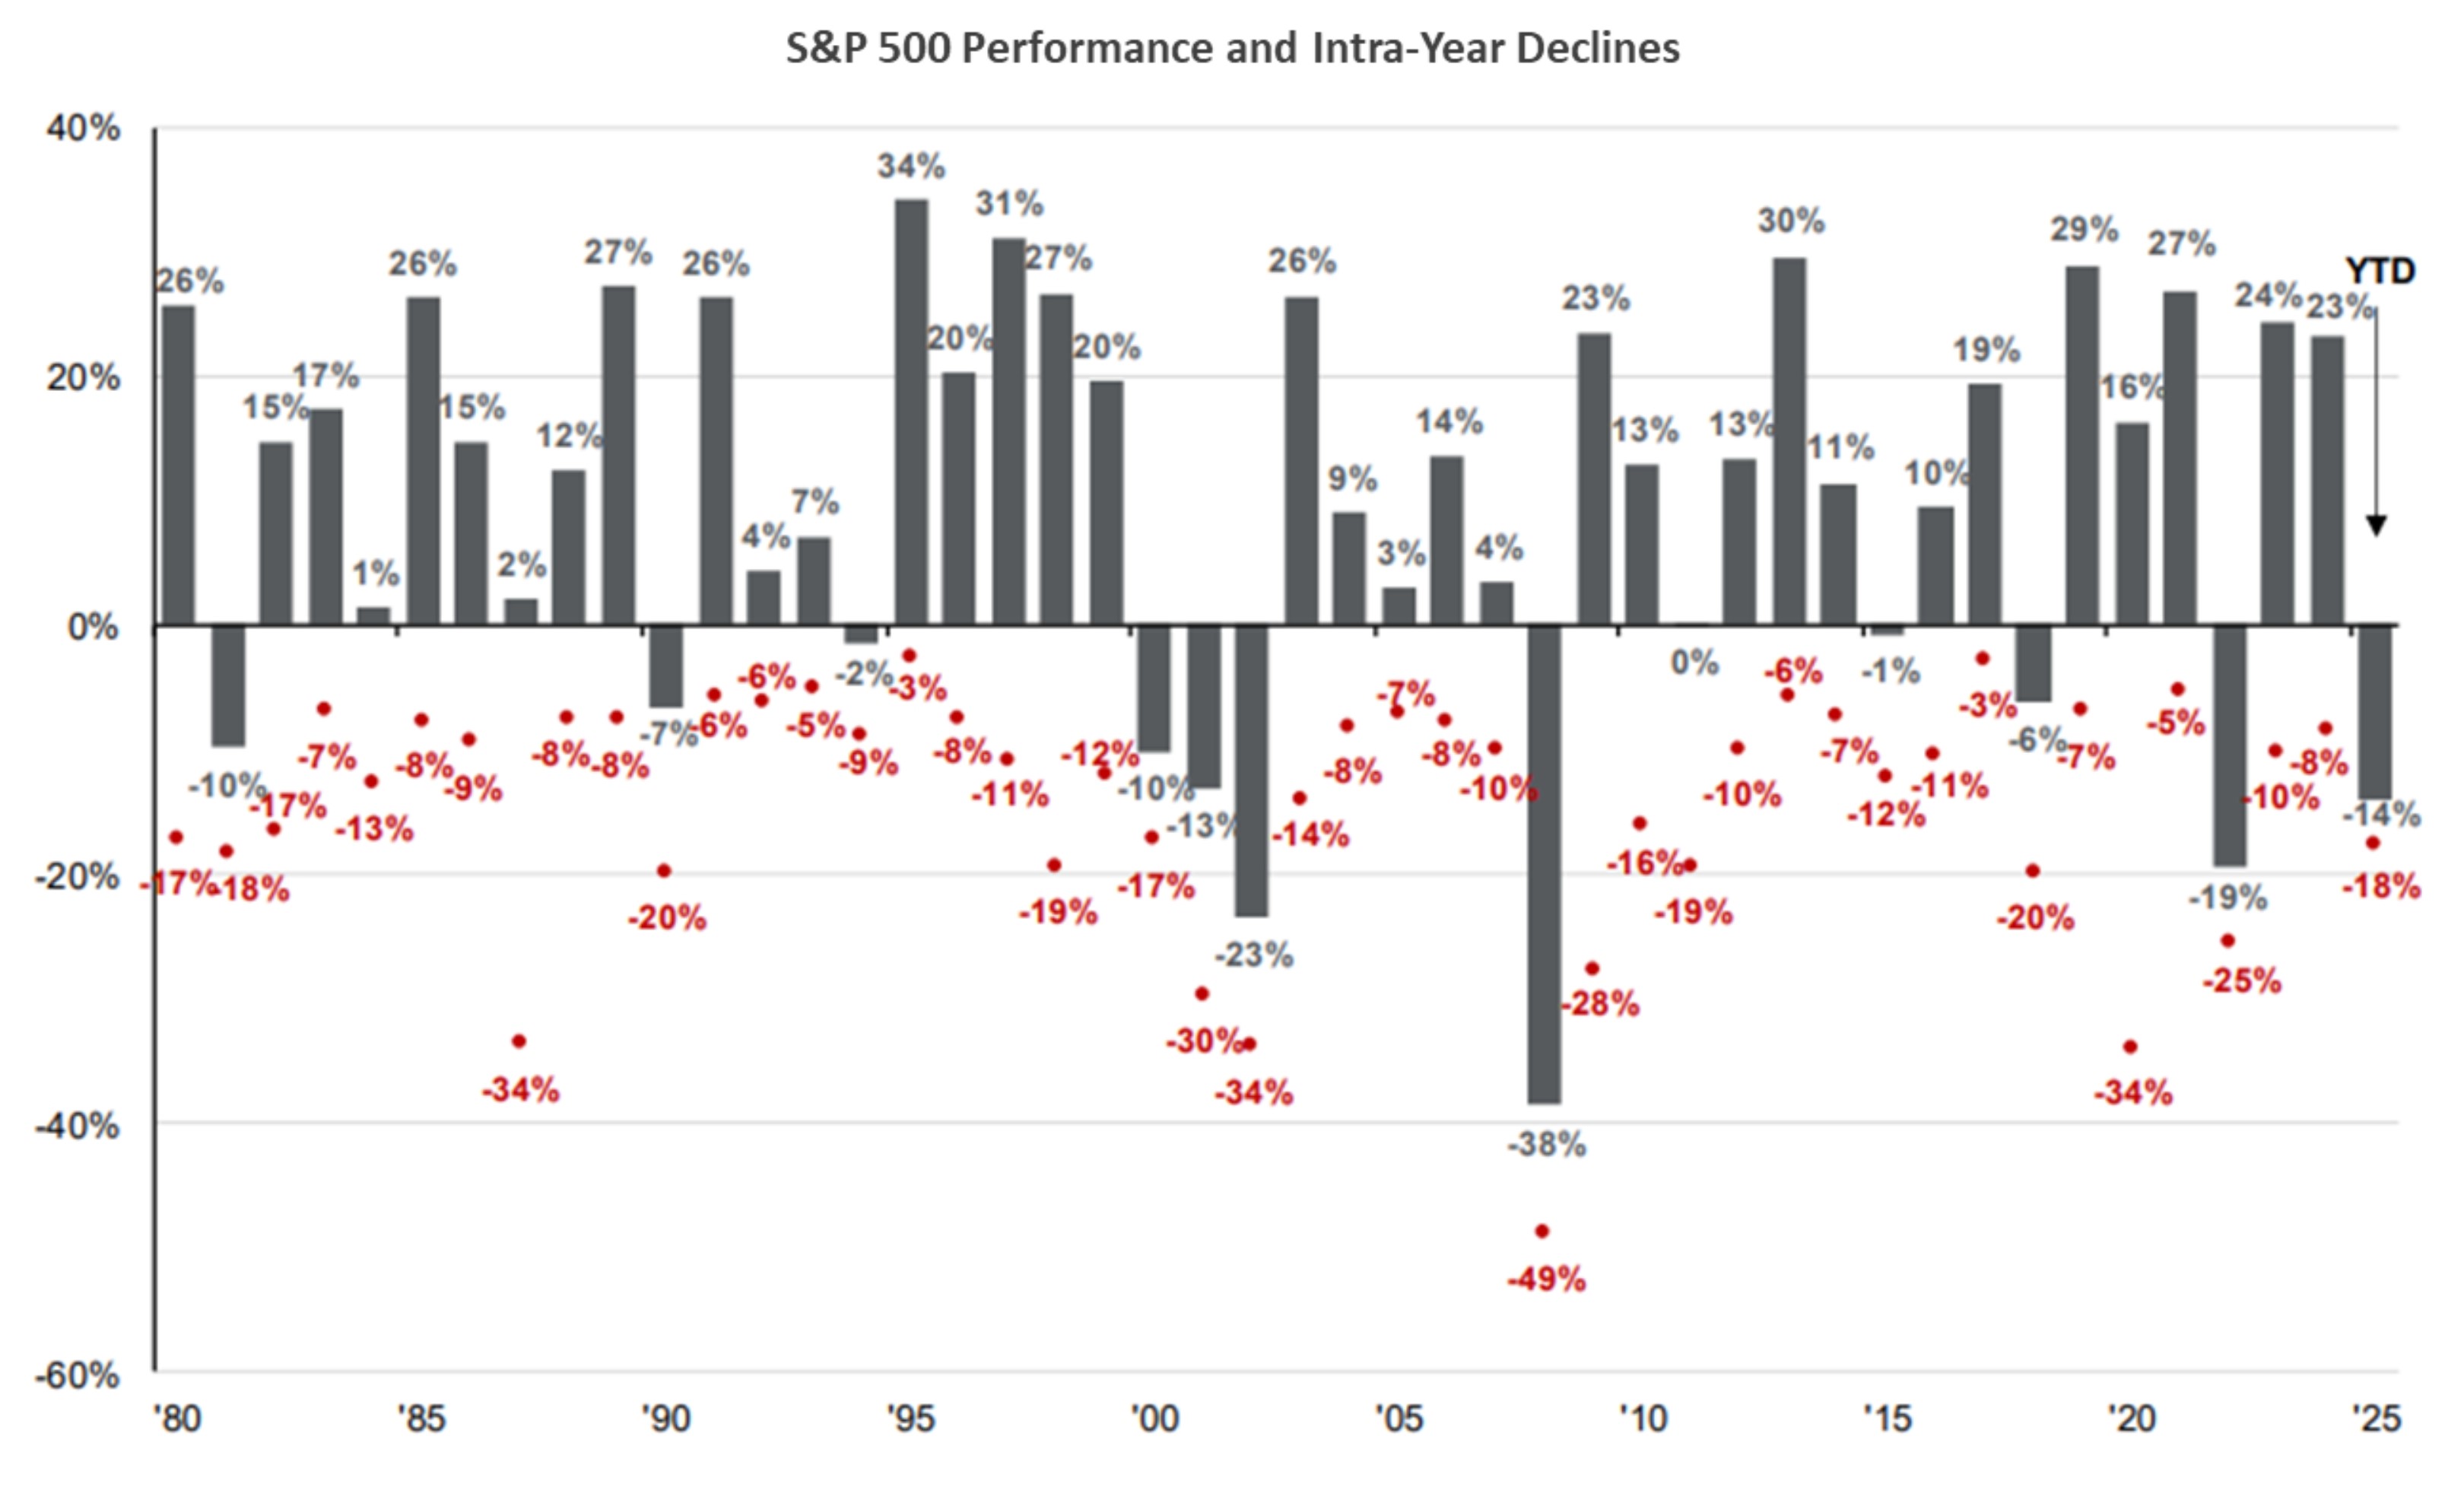
- The chart illustrates annual S&P 500 performance since 1980 (shown in columns above) and the intra-year declines during each year (shown by the red dots).
- Ex: In 2020, the S&P 500 experienced in intra-year decline of -34%, before finishing up 16% for the year.
- Over the past 45 years, the S&P 500 has experienced an average intra-year decline of 14%. Despite that, the S&P 500 had positive annual performance in 34 of the last 45 years.
- Takeaway:
- As painful as market volatility can be, equity market selloffs are normal and investors are rewarded for patience.
Playbook Summary
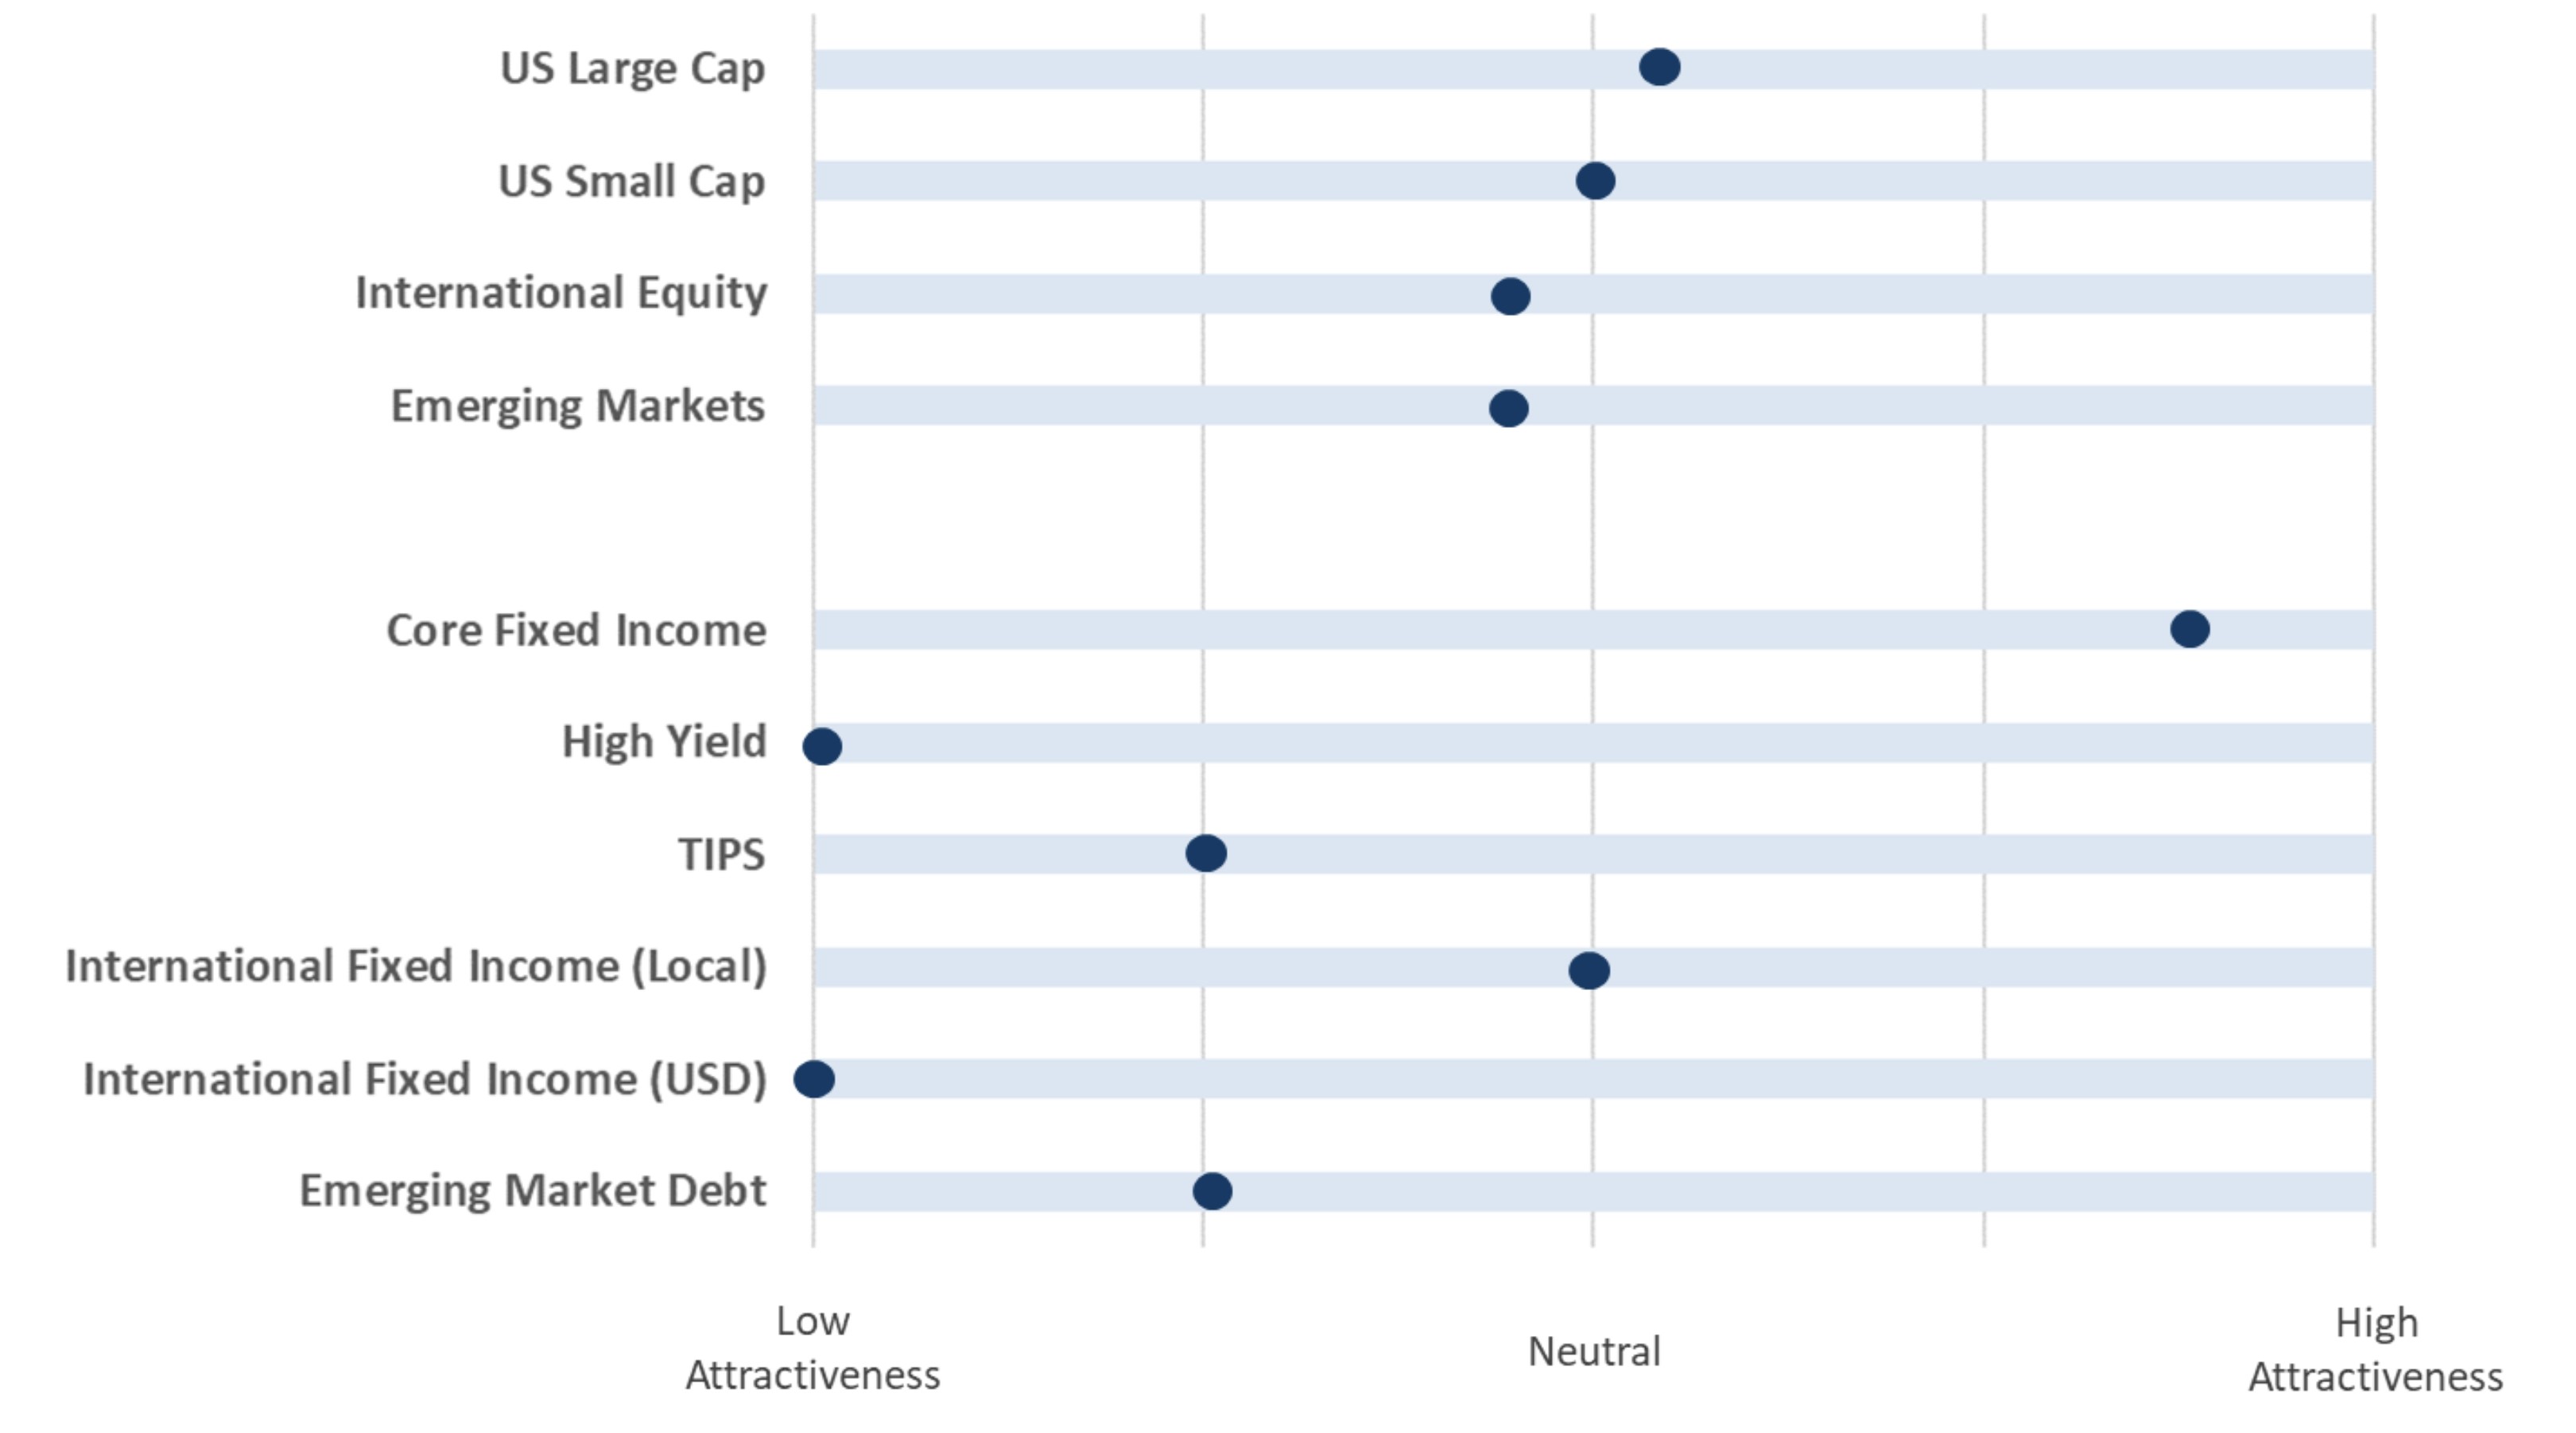
- The above table indicates where each major investment asset class falls on the distribution of attractiveness (from low to high). This table is meant to provide a standardized and comparable view of the level of opportunity in each asset class category.
- In subsequent quarters, we will discuss any movement along the scale for each asset class and the driving forces behind the change in outlook.

