Capital Markets Playbook | Q3 2024

2024 Q3 Summary
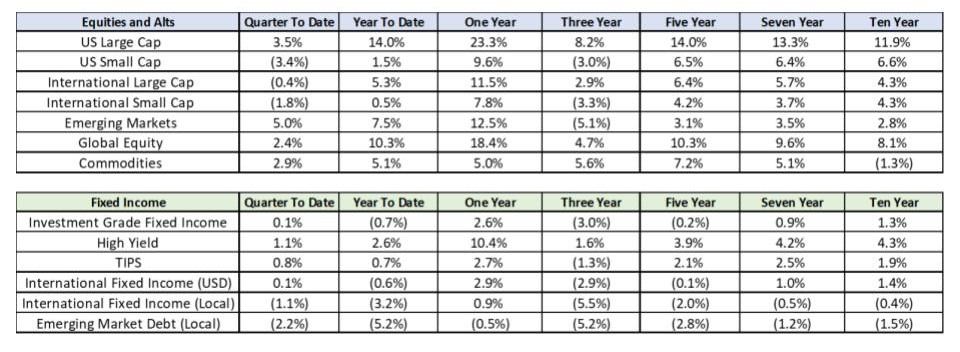
- Equity markets were mixed in the second quarter of 2024.
- U.S. small cap stocks underperformed all major equity asset classes (-3.4%). Emerging markets were the best performing equity asset class in the quarter (+5.0%).
- Enthusiasm around artificial intelligence (AI) continues to provide a boost to growth stocks in the U.S. and abroad.
- Core fixed income markets were fairly flat in the second quarter of 2024, as volatility declined during the quarter.
- High yield continued to lead all major fixed income categories in the second quarter (+1.1%), as credit spreads remain tight.
- Strength in the U.S. dollar led to underperformance in local currency fixed income asset classes.
2024: Expectations for the Year
- 2024 U.S. macroeconomy
- Expected case:
- Consumer spending grows at a slower pace, but an outright decline in consumption growth is not expected.
- Business investment slows but an outright decline in business investment is not expected.
- Unemployment increases at the margin and remains below 5%.
- Economic growth may be close to a long-term growth rate of 2%.
- Inflation will continue to be moderate but will not reach the Federal Reserve’s 2% inflation target in 2024.
- The Fed cuts rates by at least 0.25%.
- Expected case:
- 2024 equity market
- Expected case:
- Equity markets are more volatile in 2024 than in 2023.
- Companies with strong balance sheets, reliable cash flows and consistent earnings may outperform in 2024.
- International and Emerging Market equities may outperform U.S. equities as the Fed cuts rates and the dollar weakens.
- Expected case:
- 2024 fixed-income market
- Expected case:
- Volatility in fixed income markets will normalize.
- The U.S. Treasury yield curve will flatten but yield curve inversion may persist throughout most of the year.
- Shorter duration bond yields will fall as the Fed cuts its short-term policy rate.
- Intermediate and long-term yields may remain “range-bound.”
- Credit spreads on high-risk fixed income (i.e. high yield) will widen as consumer spending, business investment and economic growth slows.
- Expected case:
2024 Q2: In Review
- 2024 Q2 U.S. macroeconomic review
- Trends in macroeconomic data are showing mixed signals on the strength of the U.S. consumer and the U.S. economy.
- Reasons the U.S. consumer may be weakening (and that a slowdown in economic activity may be on the horizon):
- Consumer spending growth has declined in 2024.
- Retail sales growth, while still positive, has declined by more than 50% since December 2023.
- The growth rate in durable goods spending (cars, appliances, etc.) has been negative on a year-over-year basis in 2024.
- Labor markets have cooled in recent months and appear to be returning to pre-pandemic norms.
- The unemployment rate has increased 0.4% in 2024.
- Job openings have declined 15% over the past year.
- The level of voluntary quits is nearing levels reached prior to the pandemic.
- Signs of stress in credit are beginning to surface.
- Credit card and auto loan delinquencies have increased meaningfully in 2024.
- Consumer spending growth has declined in 2024.
- Reasons the U.S. consumer can continue to support strong economic growth:
- U.S. consumers are wealthier.
- Overall household wealth has increased in 2024, as residential real estate and stock market prices have moved higher.
- U.S. consumers remain employed.
- While the labor market may be normalizing, the unemployment rate (4.1%) remains low by historical standards.
- U.S. consumer wages are healthy.
- Wage growth (currently 4.0%) is still near its long-term average (3.9%) despite declining in 2024.
- Inflation has been slowing and short-term interest rates may be cut before the end of the year.
- The Fed has signaled that it is possible that its short-term policy rate may be cut by 25 bps as early as September 2024.
- U.S. consumers are wealthier.
- Reasons the U.S. consumer may be weakening (and that a slowdown in economic activity may be on the horizon):
- Trends in macroeconomic data are showing mixed signals on the strength of the U.S. consumer and the U.S. economy.
- 2024 Q2 equity market review
- Despite the mixed signals presented by macroeconomic data, equity market volatility remained low and global equity markets produced strong gains in Q2.
- Broad based U.S. equity markets continued to reach fresh all-time highs in Q2.
- The Dow Jones, Nasdaq and S&P 500 indices finished Q2 at, or near, all-time highs.
- Emerging market equities (+5.0%) led all major equity classes in Q2.
- U.S. large cap (+3.5%) outperformed U.S. small cap (-3.4%) and international equities (-0.4%).
- Growth stocks outperformed value stocks.
- 2024 Q2 fixed income market review
- Volatility in fixed income markets continued to decline in Q2 but remains high from a historical perspective.
- Short duration fixed income outperformed longer duration fixed income in both U.S. Treasuries and U.S. corporates.
- Intermediate corporates (+1.4%) outperformed high yield (+1.2%) and intermediate Treasuries (+0.6%).
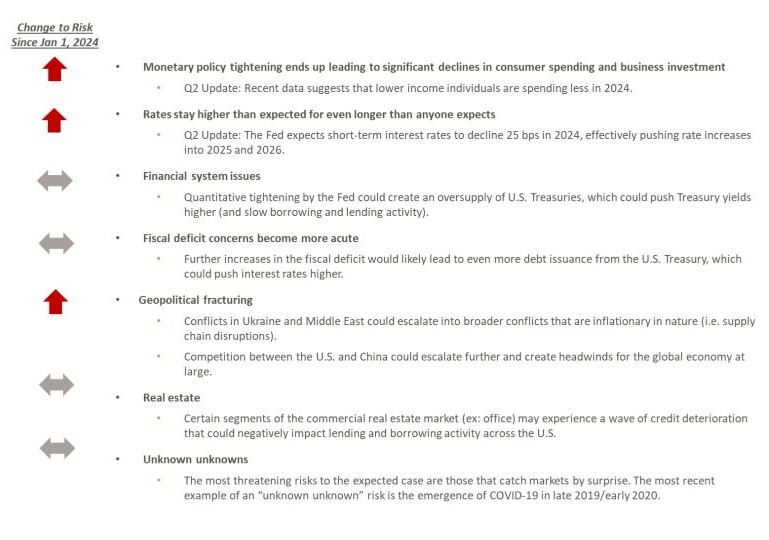
Risks to the "Expected Case" in 2024
Strong Equity Returns Have Led to Higher Valuations
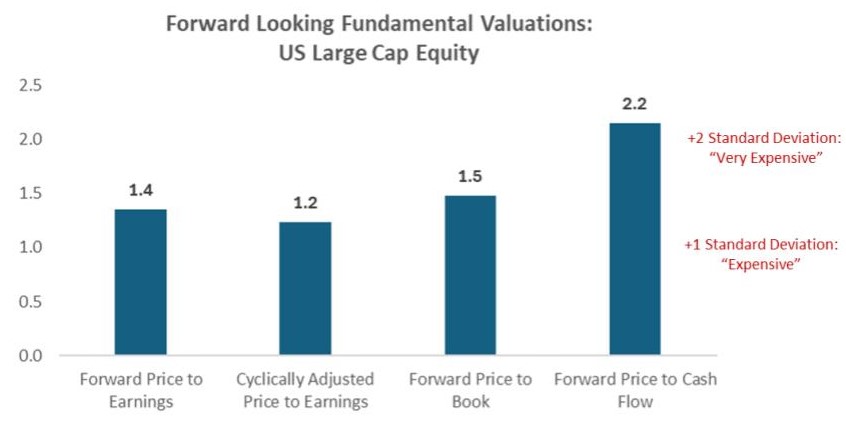
- The chart illustrates how widely tracked fundamental valuation metrics for the S&P 500 compared to long-term fundamental valuation metric averages at the end of Q2.
- Ex: Forward price-to-earnings for the S&P 500 are currently 1.4 standard deviations above the long-term average.
- All fundamental metrics suggest that U.S. large cap stocks are historically expensive (at least 1 standard deviation above the long-term average valuation).
- Some fundamental metrics suggest that U.S. large cap stocks are very expensive from a historical perspective.
- Takeaways:
- Historically speaking, the more expensive stocks are from a fundamental valuation perspective, the lower the future return potential.
- Long-term investors should stay invested in U.S. large cap stocks, but current valuations suggest that taking some “gains off the table” is prudent.
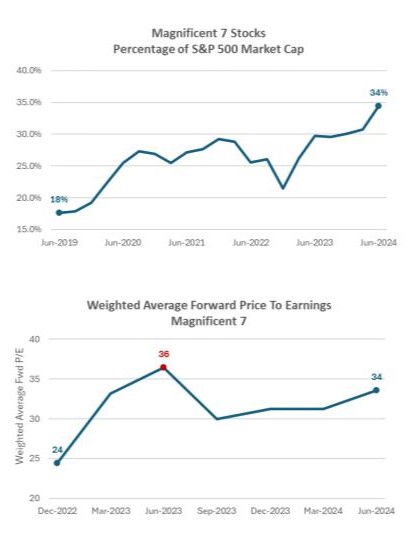
U.S. Large Cap and Artificial Intelligence
- The majority of 2024 performance gains in U.S. large cap stocks have been contributed by a small number of large cap firms that are often referred to as the “Magnificent 7.”
- Includes NVIDIA, Microsoft, Meta, Amazon, Alphabet, Apple and Tesla.
- YTD performance for Mag 7 stocks: +33%
- YTD performance for the other 493 stocks in S&P 500: 5%
- Includes NVIDIA, Microsoft, Meta, Amazon, Alphabet, Apple and Tesla.
- As a result of their outsized performance in recent quarters, Mag 7 stocks now make up more than 30% of the S&P 500’s market capitalization.
- Despite strong earnings from the Mag 7, fundamental valuations for the Mag 7 stocks remain near their most expensive levels due to the run up in their stock prices.
- Takeaways:
- Given their weight within the S&P 500 Index, the Mag 7 are likely to continue to drive the performance of U.S. large cap stocks in the months and quarters ahead.
- Expensive valuations stocks are not sustainable over the longer term.
- Expensive stocks have the most downside risk.
- Taking some gains in Mag 7 stocks (or the U.S. large cap growth mutual funds/ETFs that hold these stocks) is prudent.
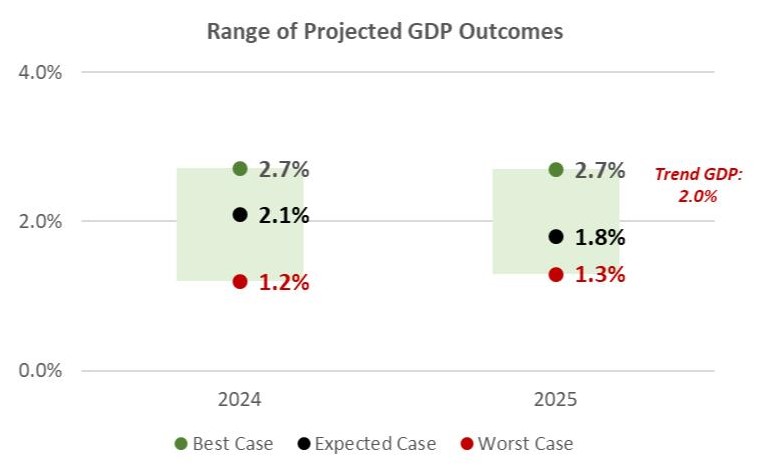
2024 Theme: Slowing Economic Growth
- Economic activity in Q2 suggests that U.S. economic growth (“real GDP”) will be close to its long-term average for 2024.
- Economic growth forecasts for the full calendar year 2024 and 2025 have moved slightly higher in recent months, as consumer spending has held up better than originally expected.
- Stronger-than-expected growth has also lowered the probability of a recession in 2024 and 2025.
- Note: Given the recent mixed economic signals, however, it is possible U.S. economic growth expectations change meaningfully in the months ahead.
- Scenarios:
- Best case
- Economic activity in the U.S. is about 0.5% to 1.0% above its long-term trend rate over the next two years.
- Expected case
- Economic activity in the U.S. is in line with its long-term trend rate over the next two years.
- Worst case
- Economic activity is 0.5% to 1.0% below its long-term trend rate over the next two years.
- A “mild” economic recession cannot be ruled out in the event of a “worst case” economic scenario.
- Best case
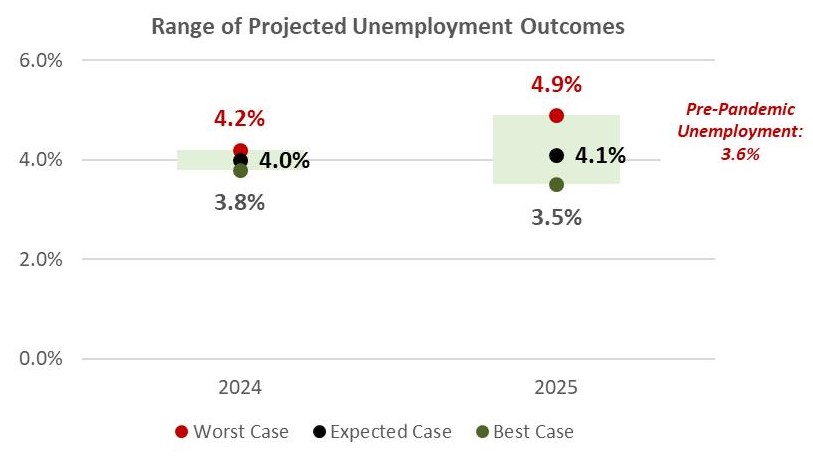
2024 Theme: Higher Unemployment, Slower Wage Growth
- The labor market has begun to cool in recent months, but unemployment remains near historical lows (4.1%).
- New job openings have declined, and recent surveys indicate that more employers are delaying hiring plans.
- Scenarios:
- Best case
- Unemployment declines slightly from its current level and remains near historical lows over the next two years.
- Expected case
- As economic growth slows in the U.S., unemployment ticks higher, but remains low by historical comparison.
- Worst case
- Unemployment approaches 5.0% by the end of 2025 as a result of meaningfully slower economic growth.
- Best case
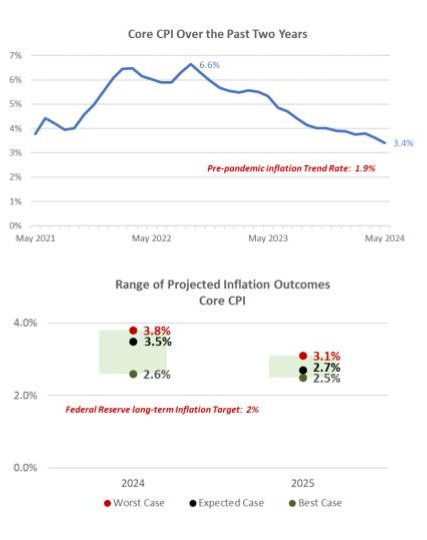
2024 Theme: Slowing Inflation
- In recent months, inflation has begun to moderate after a brief pause in Q1
- Core Consumer Price Index (CPI) inflation has declined 0.5% in 2024 to 3.4%. This inflation measure has nearly halved since the fall of 2022.
- The Fed’s preferred measure of inflation, Core Personal Consumption Expenditures (PCE) has declined to 2.6% (only 0.6% above the Fed’s inflation target).
- Scenarios:
- Best case
- Inflation falls as a result of slower economic growth and is close to the Fed’s long-term inflation target before the end of 2025.
- Expected case
- Inflation continues to moderate slowly and is slightly higher than the Fed’s 2% target by the end of 2025.
- Worst case
- Inflation continues to be sticky throughout the aggregate economy and remains well above the Fed’s long-term inflation target through the end of 2025.
- Best case
- Scenarios:
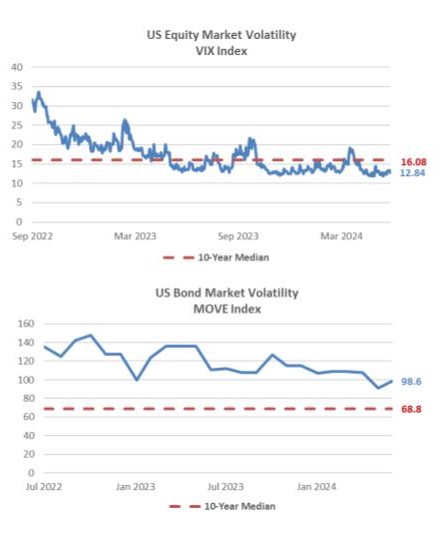
2024 Theme: Market Volatility
- Despite mixed economic signals, equity market volatility has been well below its long-term median in the first half of 2024.
- Volatility in fixed income markets has been declining in recent months but remains much higher than normal.
- Equity market volatility is likely to increase in the second half of 2024 while fixed income volatility is expected to decline as the Fed begins to cut its short-term policy rate.
- Takeaways:
- Market volatility is, by definition, a function of uncertainty.
- Volatility will decline as market participants have more clarity into the future of inflation, monetary policy, economic growth, etc.
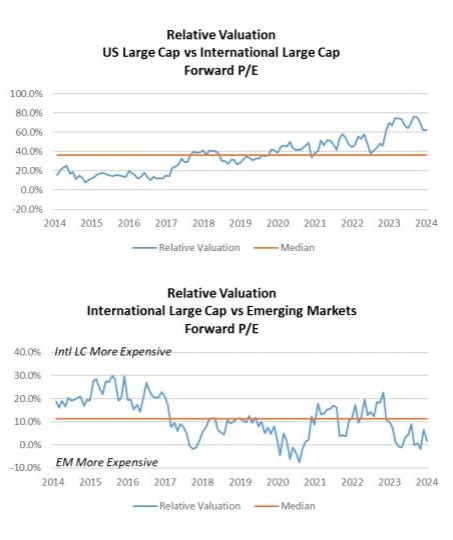
2024 Playbook: International Equity
- Fundamental valuation metrics suggest that U.S. equities are expensive on a relative basis.
- International equities and emerging market equities are more attractive than U.S. large cap on a relative valuation basis.
- Economic considerations:
- If global economic growth surprises to the upside, international and emerging market equities will likely outperform U.S. equities.
- If there is a global economic recession, U.S. equities will likely outperform international and emerging market equities.
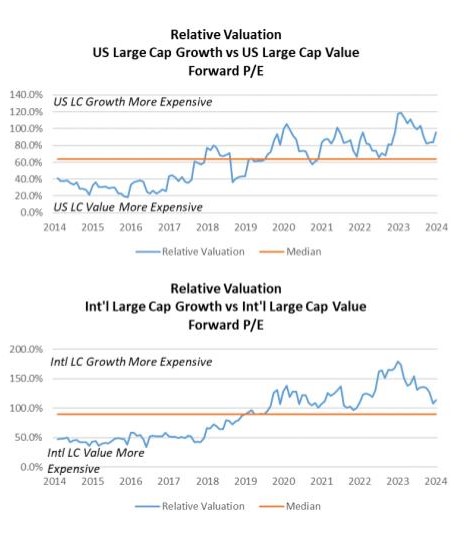
2024 Playbook: U.S. Equity
- Fundamental valuation metrics suggest that growth equities are still substantially more expensive than value equities.
- Economic consideration:
- Value equities carry less risk than growth equities. Growth stocks typically sell off more than value stocks as concerns over economic growth materialize.
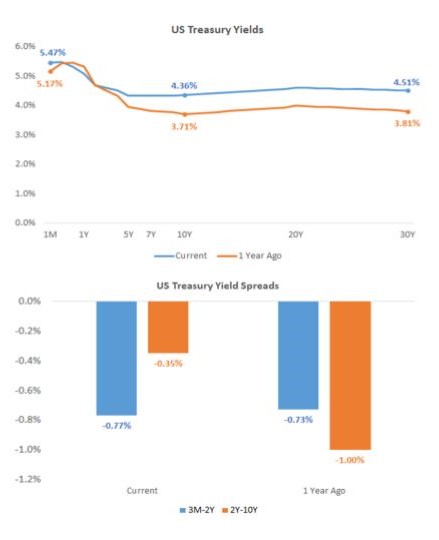
2024 Playbook: Fixed Income
- Key sections of the U.S. Treasury yield curve have been inverted since summer of 2022.
- Certain sections of the yield curve (2-10 year) have steepened (i.e. became less inverted) in Q2.
- Yield curve inversion occurs when short-term rates are higher than long-term rates.
- Yield curve inversion has historically led to disruptions in borrowing and lending activity that may result in meaningful declines in economic activity.
- The longer a yield curve inversion persists (and the larger the size of the inversion), the more likely lending and borrowing activity will decline meaningfully.
- Economic considerations:
- It is likely that the yield curve will flatten but remain inverted into 2025.
- The yield curve will likely remain inverted until the Fed cuts its short-term policy rate by more than 1%.
A Note About Equity Market Selloffs
- Long-term investors should remember that equity market selloffs are often followed by periods of above normal returns.
- Investors that try to time market selloffs (i.e., sell stocks ahead of a market decline) usually fail to reinvest prior to the subsequent stock market recovery.
- Takeaways:
- Long-term investors should never attempt to time the market.
- Riding out market volatility is the best way to build wealth over the long term.

2024 Playbook Summary
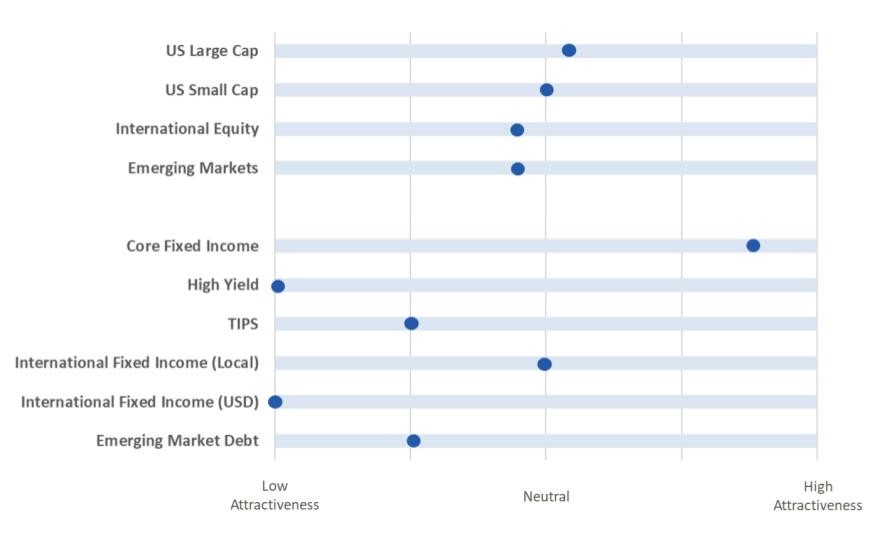
- The above table indicates where each major investment asset class falls on the distribution of attractiveness (from low to high). This table is meant to provide a standardized and comparable view of the level of opportunity in each asset class category.
- In subsequent quarters, we will discuss any movement along the scale for each asset class and the driving forces behind the change in outlook