Market Flash Report | July 2024

Economic Highlights
United States
- The U.S. economy grew at a greater-than-expected annualized rate of 2.8% during Q2 2024. This marked significant outperformance relative to the 2.1% estimate and 1.4% reading from Q1. Personal consumption expenditures, the main proxy for consumer activity, increased 2.3% for the quarter, up from the 1.5% acceleration in Q1. Both services and goods spending saw solid increases for the quarter. Inventories also contributed significantly, adding 0.82% to the total gain. Government spending also added a tailwind, rising 3.9% at the federal level, including a 5.2% surge in defense outlays. On the downside, imports, which subtract from GDP, jumped 6.9%, the biggest quarterly rise since Q1 of 2022. Exports were up just 2%. One negative in the Q2 GDP report was the decline in the savings rate from 3.8% in Q1 to 3.5%.
- The July employment report missed expectations, with only 114,000 new jobs added to the U.S. economy versus the 185,000 estimate. The unemployment rate jumped to its highest level since October 2021 at 4.3%, and the May and June reports were revised lower. The broader U-6 unemployment rate surged higher by 0.4% to 7.8%. Average hourly earnings increased 0.2% M/M and 3.6% Y/Y. Following the disappointing report, markets were pricing in a 100% probability of a 25 bps rate cut by the Federal Reserve in September and a 73% chance of a 50 bps rate cut. Five rate cuts are being priced in by the end of 2024.
- The personal consumption expenditures (PCE) price index, a key measure for the Fed, increased 2.6% in Q2, down from the 3.4% move in Q1. Excluding food and energy, core PCE prices, which the Fed focuses on even more as a long-term inflation indicator, were up 2.9%, compared to a 3.7% increase in Q1. According to the most recent Consumer Price Index (CPI) report, inflation fell 0.1% M/M in June but rose 3% Y/Y. Core CPI rose 0.1% M/M and 3.3% Y/Y.
- Manufacturing in the U.S. exhibited further weakness in July based on the ISM Manufacturing Purchasing Managers’ Index (PMI), which fell to 46.8 from 48.5 in June. New orders, production and employment all weakened in July and remain firmly in contraction territory.
Non-U.S. Developed
- The eurozone economy grew at a better-than-expected pace of 0.3% Q/Q in Q2. Q1 GDP was 0.3% and the Q2 expectation was 0.2%. After falling into recession at the end of 2023, the eurozone economy has rebounded back into growth territory, albeit at a slow pace and with a murky outlook. The July inflation report showed headline prices rising 2.6%. Core inflation rose 2.9% and services inflation increased 4%.
- The eurozone composite PMI fell to a five-month low of 50.1 in July (down from 50.9 in June). The services component hit a four-month low while the manufacturing component fell to a seven-month low at 45.6. Manufacturing was the main source of weakness in July due to a major decline in production. The two largest eurozone economies continued to underperform the wider region. Output in Germany decreased for the first time in four months, while France posted a third consecutive monthly reduction in business activity.
- The Bank of Japan (BOJ) finally hiked interest rates for the first time in more than a decade. The short-term policy rate moved from 0-0.1% to 0.25%. In addition, the BOJ also unveiled a plan to slow its massive bond buying program. These monetary tightening steps appear increasingly necessary to combat rising inflation and the weakening yen.
Emerging Markets
- China’s GDP missed expectations in Q2 with a print of 4.7% Y/Y growth. The Q2 reading was below the 5.1% expectation and 5.3% growth reported in Q1. The slowdown in Q2 is attributed to broad-based economic weaknesses, with the most significant impact coming from domestic demand. There has been a clear shift in GDP growth contributions from final consumption (private and government) to gross capital formation. It all highlights the government’s delicate balancing act between providing stimulus for weakening economic activity and the headwinds from unbalanced growth and the property sector overhang.
- Retail sales in China posted their first monthly decline in June (-0.1%) since the end of 2022. The weak retail sales reading is not surprising given the insufficient policy measures targeting domestic demand. The persistent drag from domestic demand is evident in various indicators, including subdued CPI inflation, soft credit demand and declining imports. Industrial production in China accelerated in June to an annualized rate of 5.3%, led mostly by resilience in the manufacturing sector.
- Consumer inflation has been in positive territory for the past five months in China, but the trend remains weak and producer prices are firmly in deflationary territory. Both the official and Caixin Manufacturing PMIs are in contraction territory based on the latest July data, and the official services PMI fell to an 8-month low of 50.2.
- While the Chinese government continues to target around 5% GDP growth in 2024, many of the leading indicators suggest weakening activity and a slowdown on the horizon. Exports have remained in solid shape, but imports and domestic demand are sluggish.
Fixed Income
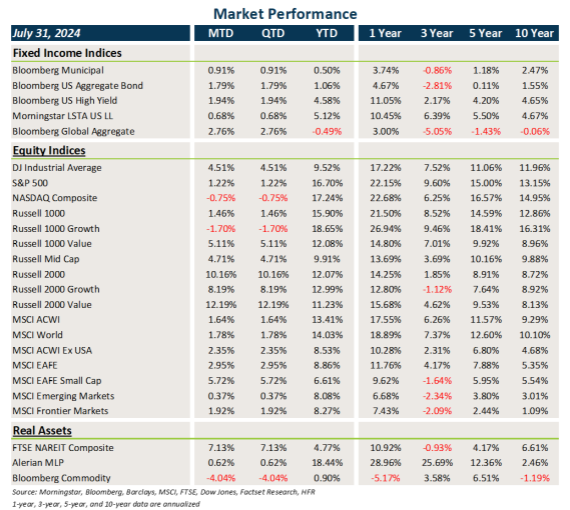
- It was a good month for fixed income overall, with the decline in rates and modest spread tightening.
- Core fixed income and municipal bonds posted strong gains in July, led by the fall in Treasury and other sovereign debt yields.
- Credit gained ground last month, led by some modest spread tightening and continued clipping of elevated coupons.
- USD weakness was a tailwind for non-U.S. bonds.
U.S. Equities
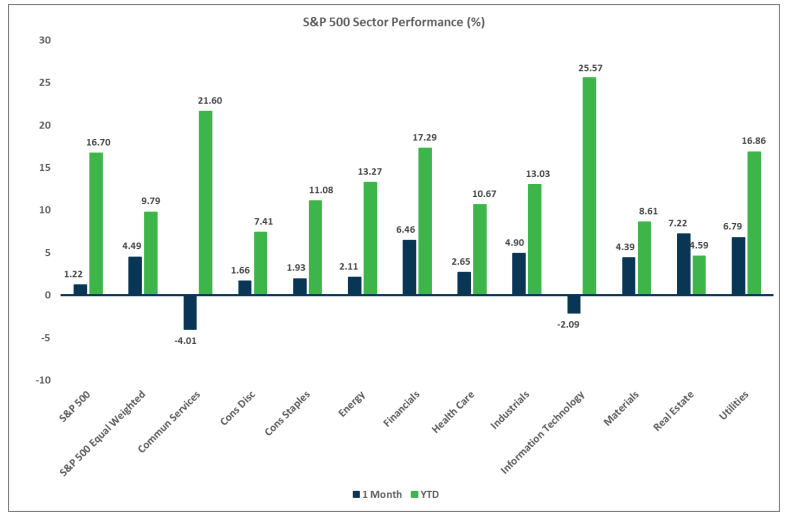
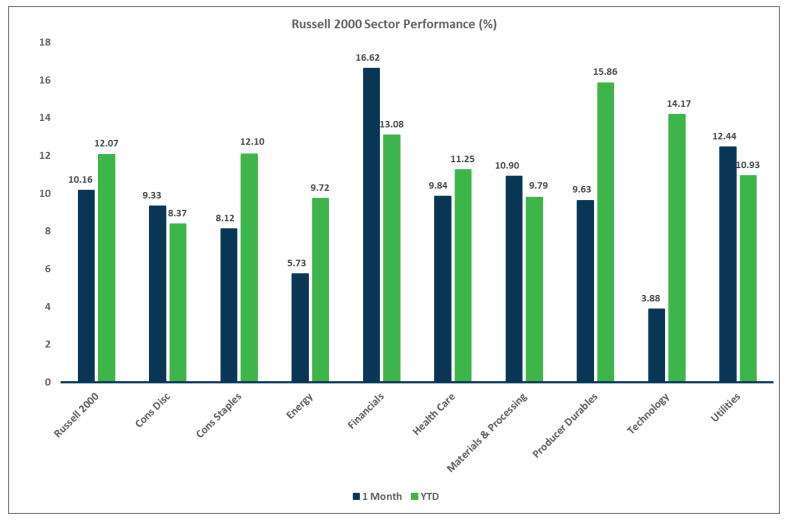
- U.S. equities broadly gained ground in July, led by the surge in small caps and value stocks.
- Value trounced growth last month and small caps sharply outperformed large caps.
- The S&P 500 has gained 16.7% YTD, and the Russell 2000 has risen 12.1%.
Non-U.S. Equities
- Equities outside the U.S. generally gained ground last month, with mixed results relative to U.S. equities. USD weakness provided a nice boost.
- Similar to what occurred in the U.S., value outperformed growth and small caps beat large caps.
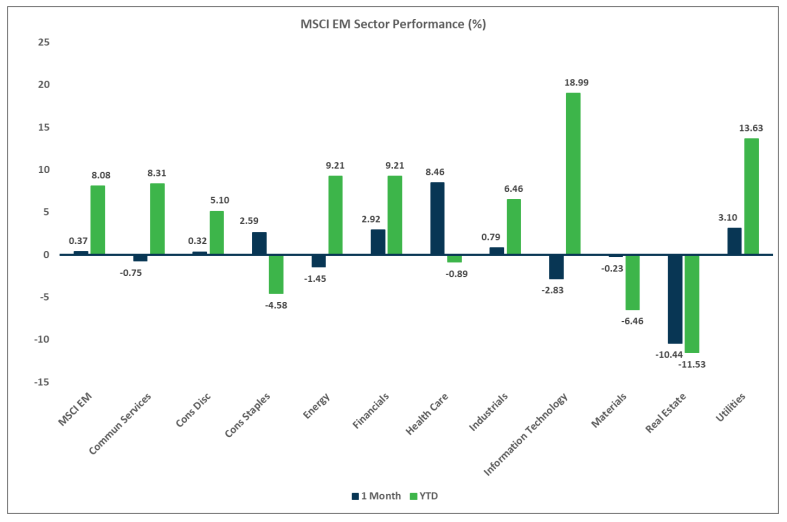
- Emerging markets underperformed developed markets in July, primarily due to weakness in China and Eastern Europe.
Sector Performance - S&P 500 (as of 07/31/24)
Sector Performance - Russell 2000 (as of 07/31/24)
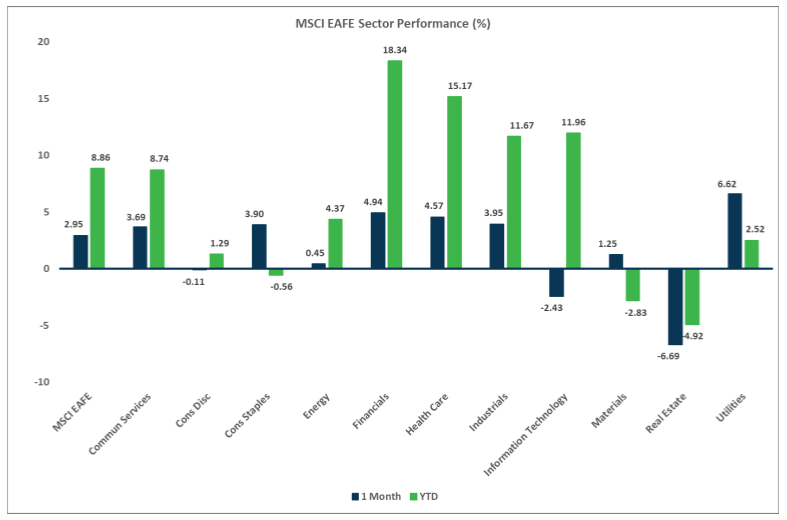
Sector Performance - MSCI EAFE (as of 07/31/24)
Sector Performance - MSCI EM (as of 07/31/24)