Market Flash Report October 2024

Economic Highlights
United States
- The U.S. economy expanded at a slower than expected clip of 2.8% in Q3, below the 3.1% estimate from economists and the 3% rate recorded in Q2. While this is down from Q2’s 3% rate, it continues to demonstrate why the U.S. economy is the envy of the world. Consumer spending increased 3.7% for the quarter, the strongest performance since Q1 of 2023, contributing nearly 2.5% to the total. Another major contributor was federal government spending, which grew higher by 9.7%, pushed by a 14.9% surge in defense outlays. Fiscal spending at the federal level contributed 0.6% to the GDP growth rate. The 11.2% jump in imports detracted from Q3 GDP growth.
- U.S. employers added just 12,000 new jobs to the economy in October, well below the 100,000 expectation. Revisions lowered previously reported job creation totals by 112,000 for August and September combined. The Boeing strike likely subtracted 44,000 jobs from the total and the two hurricanes were also cited as excuses for the subpar report. Surprisingly, the unemployment rate held steady at 4.1% and average hourly earnings increased 4% Y/Y. Almost all of the job gains came from the government and healthcare sectors.
- Personal Consumption Expenditures (PCE) inflation increased 0.2% M/M in September or 2.1% versus the prior year. Core PCE, the preferred gauge of the Federal Reserve, rose a hotter than anticipated 0.3% M/M in September or 2.7% Y/Y. The move in inflation was tilted toward services prices, which increased 0.3% while goods prices decreased 0.1%. One other inflation data point was the Employment Cost Index, which increased 0.8% in Q3 or 3.9% over the past year. September’s Consumer Price Index (CPI) report showed headline inflation increased 0.2% M/M or 2.4% Y/Y while core CPI rose 0.3% M/M or 3.3% Y/Y.
- U.S. retail sales rose more than expected in September with a gain of 0.4%. Core retail sales, a reading used for GDP, increased 0.7%. The October ISM Manufacturing Purchasing Manager’s Index (PMI) fell to 46.5 from 47.2 in September, largely due to weakness in production.
Non-U.S. Developed
- The eurozone composite PMI hit a two-month high, albeit at 49.7, which is below the 50 level that separates contraction from expansion. Services fell to an eight-month low while manufacturing rose to a five-month high of 45.9. The important new orders component fell to a fresh five-month low, highlighting weakening demand. The two largest eurozone economies, Germany and France, were again the main sources of weakness, seeing further marked reductions in business activity at the start of Q4. Economists believe the eurozone economy is stuck in a rut with deteriorating growth expectations. The European Central Bank (ECB) has cut rates three times by 25 bps thus far in 2024 and the easing path is likely to continue to support the economy.
- Eurozone inflation accelerated more than expected in October on food and energy prices, but it remained within the target of the ECB, bolstering the case for gradual monetary policy easing. Prices rose 2% last month, up from 1.7% in September. Core inflation held steady at 2.7%. The unemployment rate in the eurozone also held flat at 6.3% in September.
- The Bank of Japan (BOJ) held interest rates steady at 0.25%. Inflation has come down a bit in the country and the BOJ has backed off of its hawkish monetary stance as a result. They expect GDP growth of 1.1% in 2025 and 1% in 2026. CPI excluding fresh food is projected to be around 1.9% over the next two years.
Emerging Markets
- China’s GDP grew 4.6% during Q3, slightly ahead of the 4.5% estimate, but down from 4.7% reported in Q2. The government has a target of 5% growth in 2024 and 4.5% in 2025. The People’s Bank of China (PBOC) has sharply ramped up policy stimulus since late September, but experts believe much more is needed, and quickly, to reach the growth target and put the economy on more solid footing next year. Longer-term structural challenges such as overcapacity, high debt levels and an aging population are also major concerns. Other key data points announced included a 5.4% jump in industrial output, a 3.2% increase in retail sales, a 3.4% rise in fixed asset investment and a 10.1% decline in property investment.
- Manufacturing in China expanded for the first time since April with an October PMI reading of 50.1. The official non-manufacturing PMI also rose to 50.2 in October, up from 50 in September.
- China’s economic growth has slowed, dragged down by tepid consumer demand and a real estate slump. Exports have been a rare bright spot and the PBOC hopes that its last-ditch stimulus measures provide an added boost at the end of the year.
- India's government has projected economic growth of between 6.5% and 7% for the current fiscal year, down from 8.2% in the previous year, citing heightened geopolitical risks. Some of those risks include escalating geopolitical conflicts, deepening geoeconomic fragmentation and elevated valuations in financial markets in some advanced economies.
Fixed Income
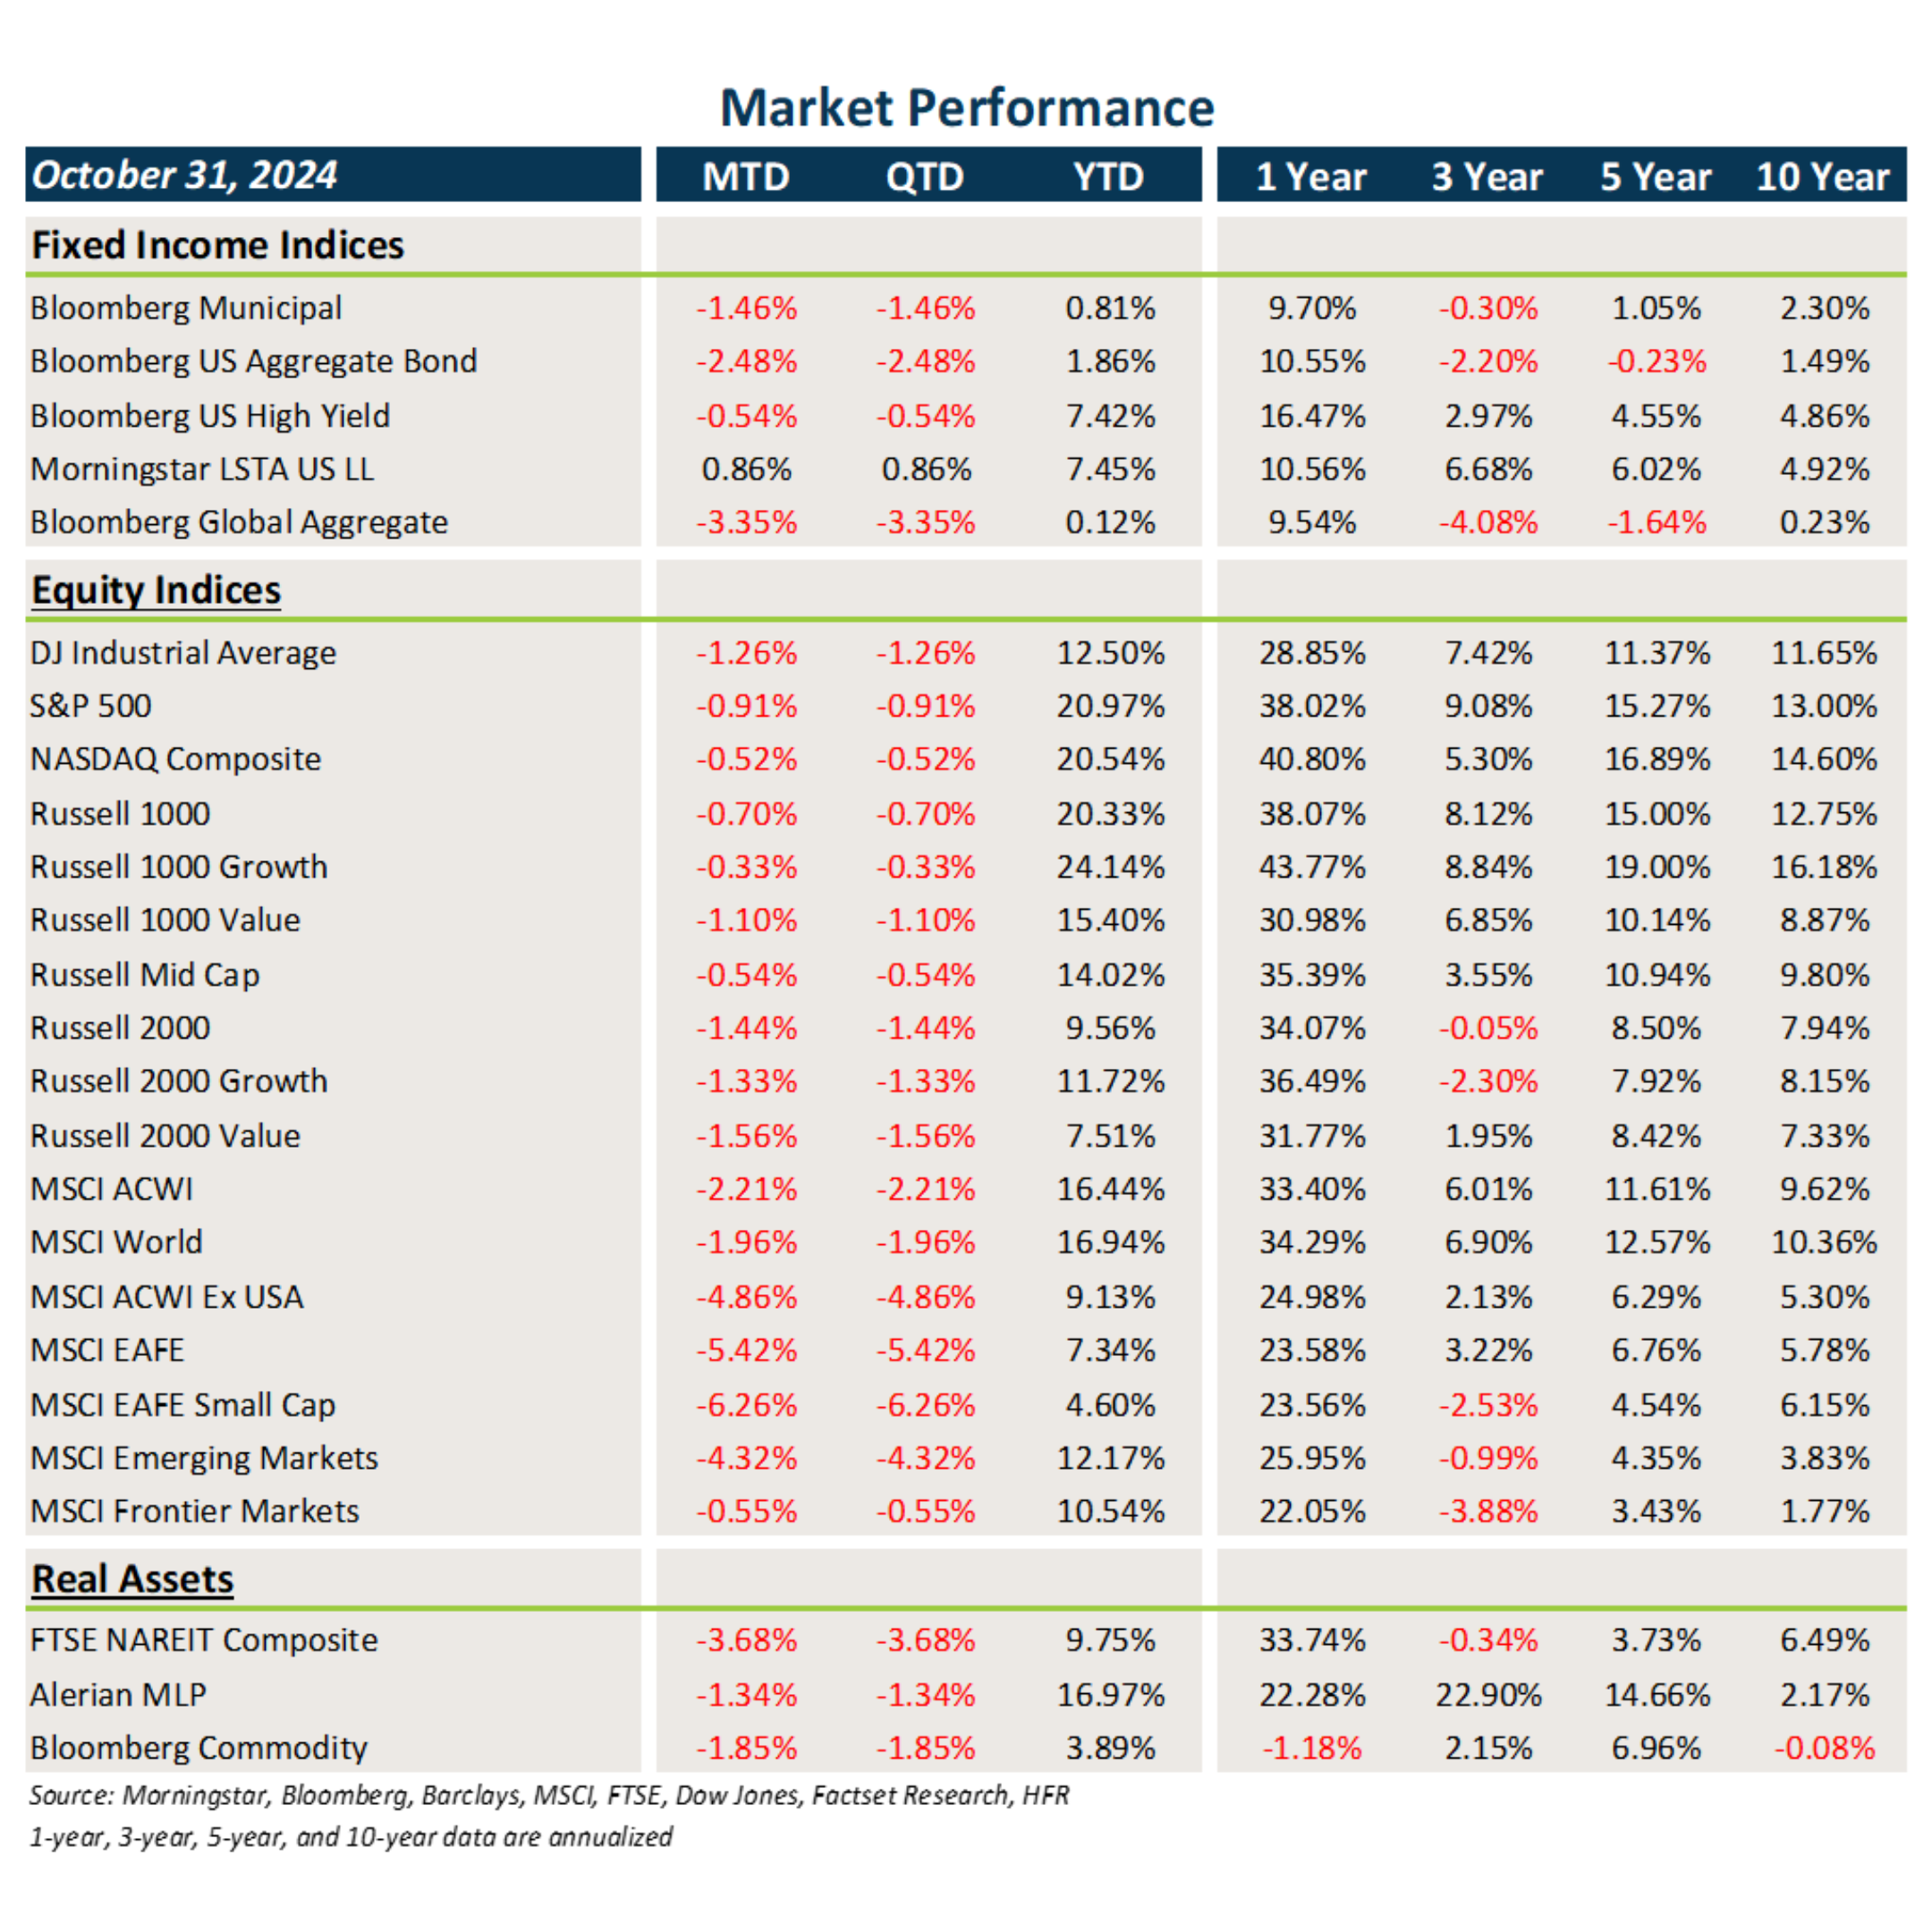
- Treasury and other sovereign debt yields marched sharply higher in October, leading to broad losses in core fixed income, munis and global bonds.
- Credit spreads generally tightened in October. Credit held up better due to the higher starting carry and favorable movement in spreads.
- Bonds outside the U.S. were also hit by the stronger U.S. dollar.
U.S. Equities
- U.S. equities fell in absolute terms but held up better than non-U.S. equities on a relative basis.
- Large caps beat small caps and growth outpaced value within both large caps and small caps.
- The one-year returns across U.S. equities are pretty astonishing with gains in the 30-45% range.
Non-U.S. Equities
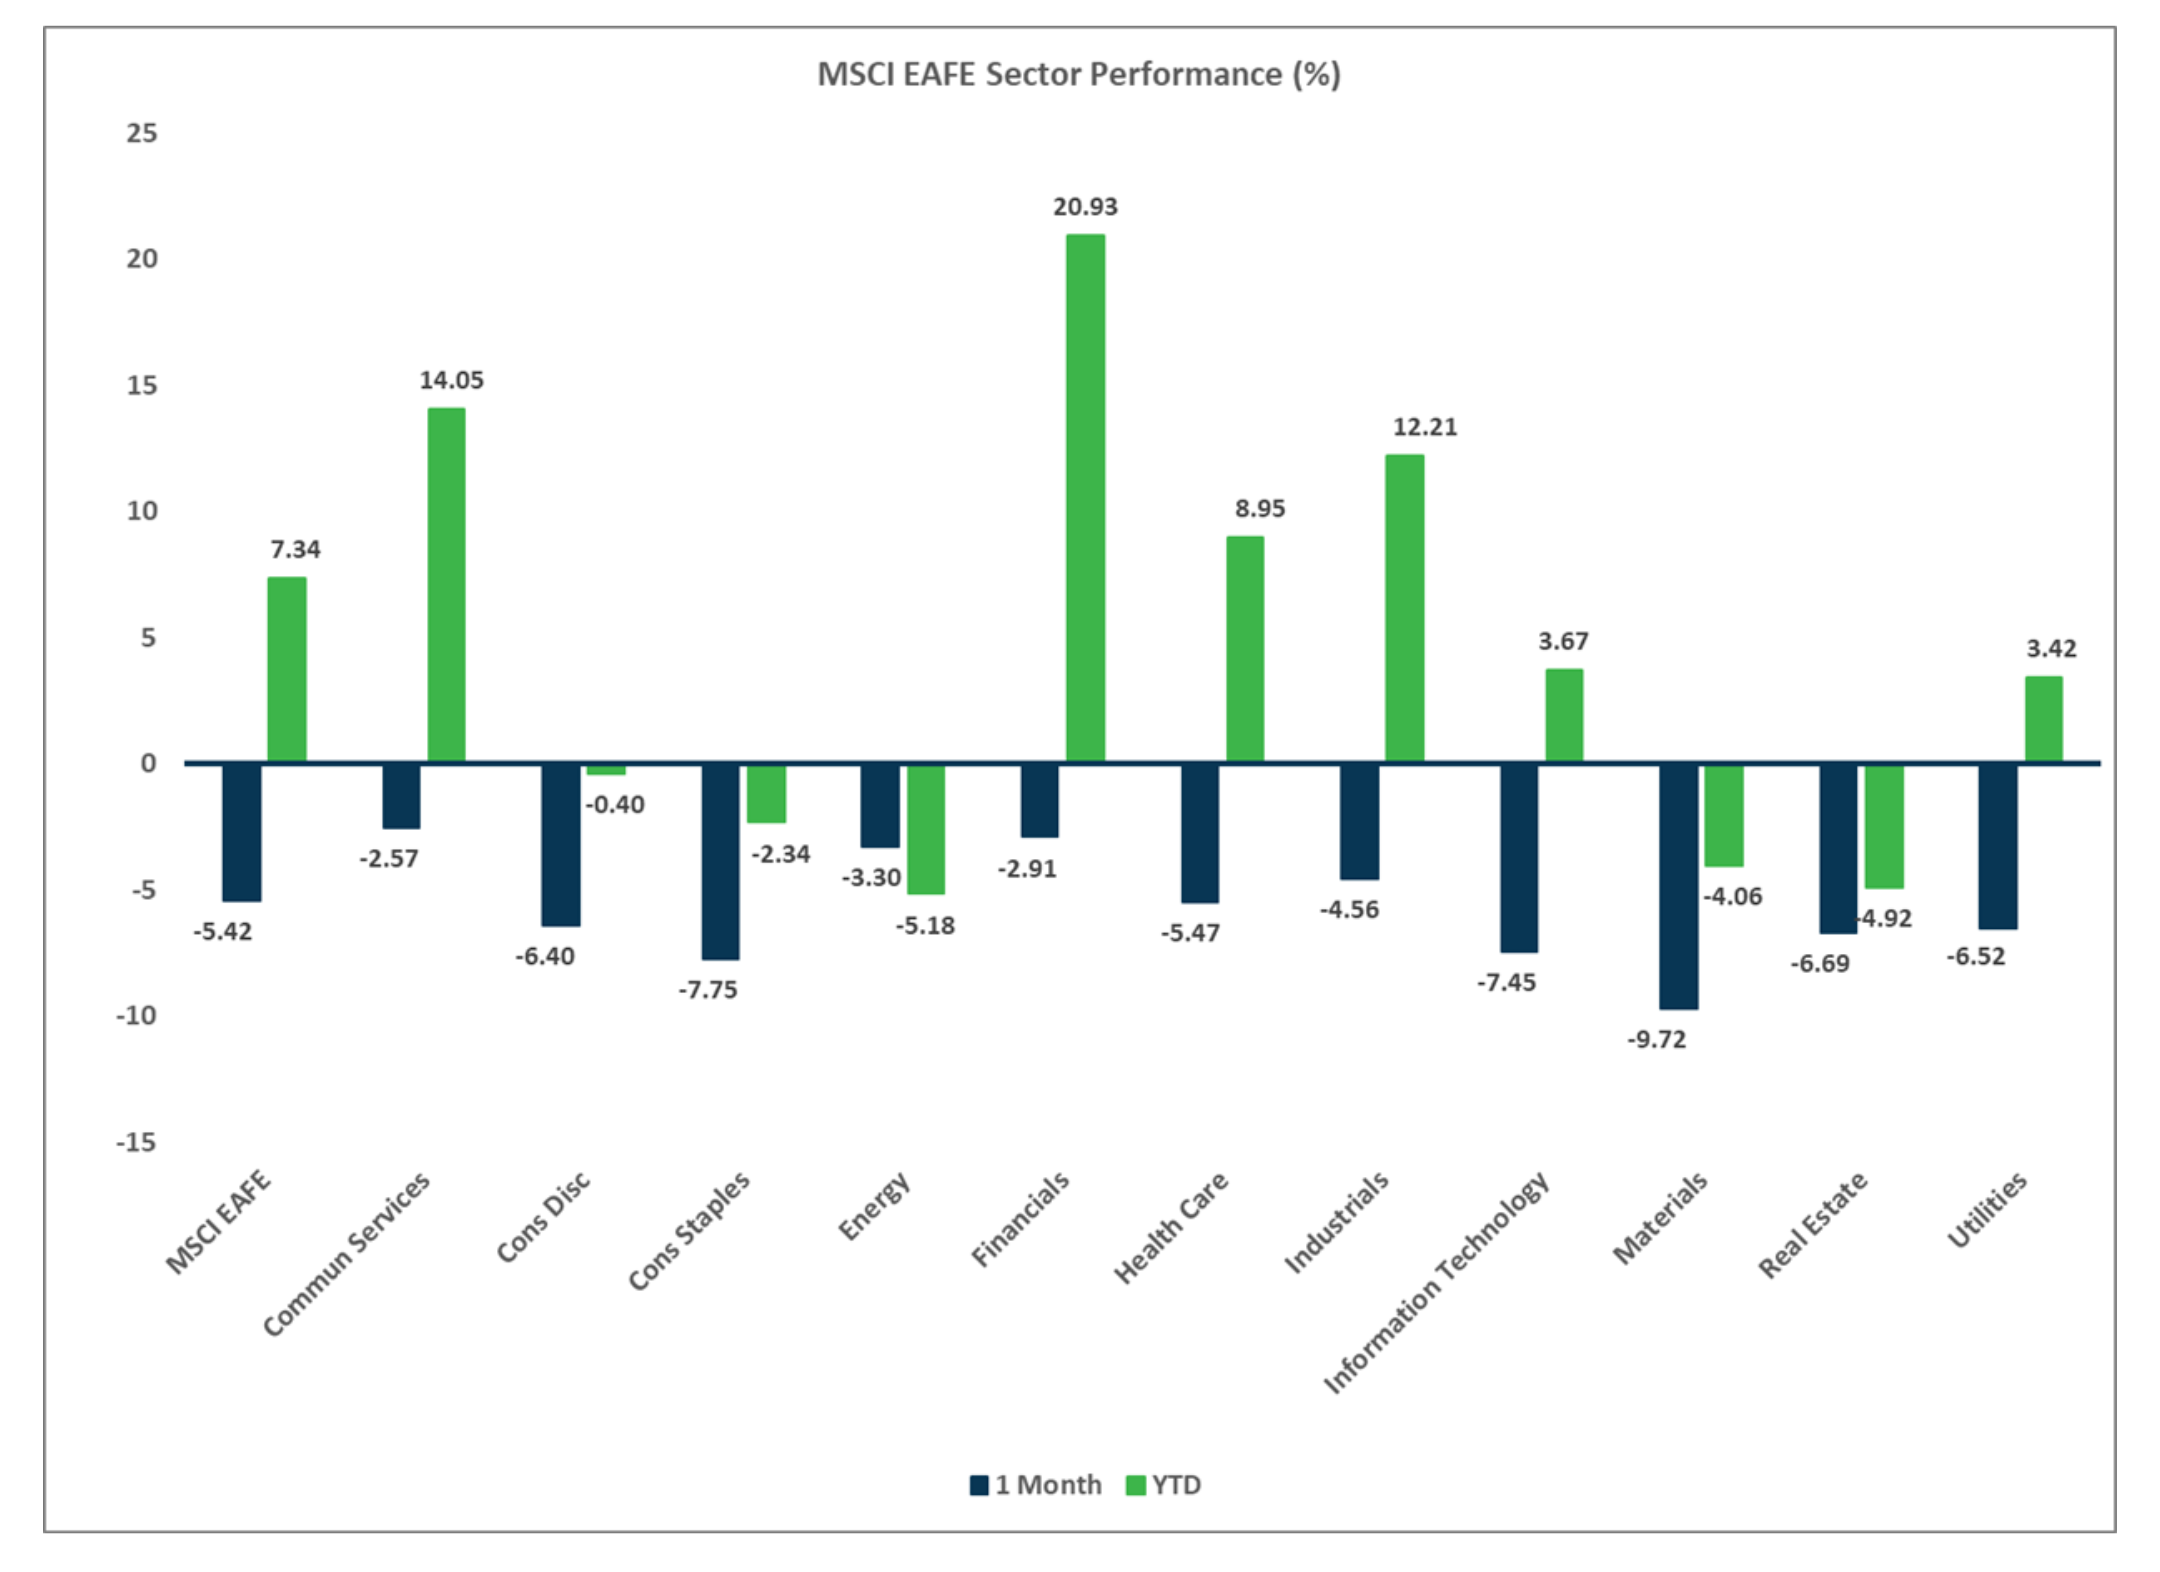
- Developed markets outside the U.S. exhibited broad weakness last month, led primarily by losses in Europe.
- Within EAFE markets, value beat growth and small caps underperformed large caps.
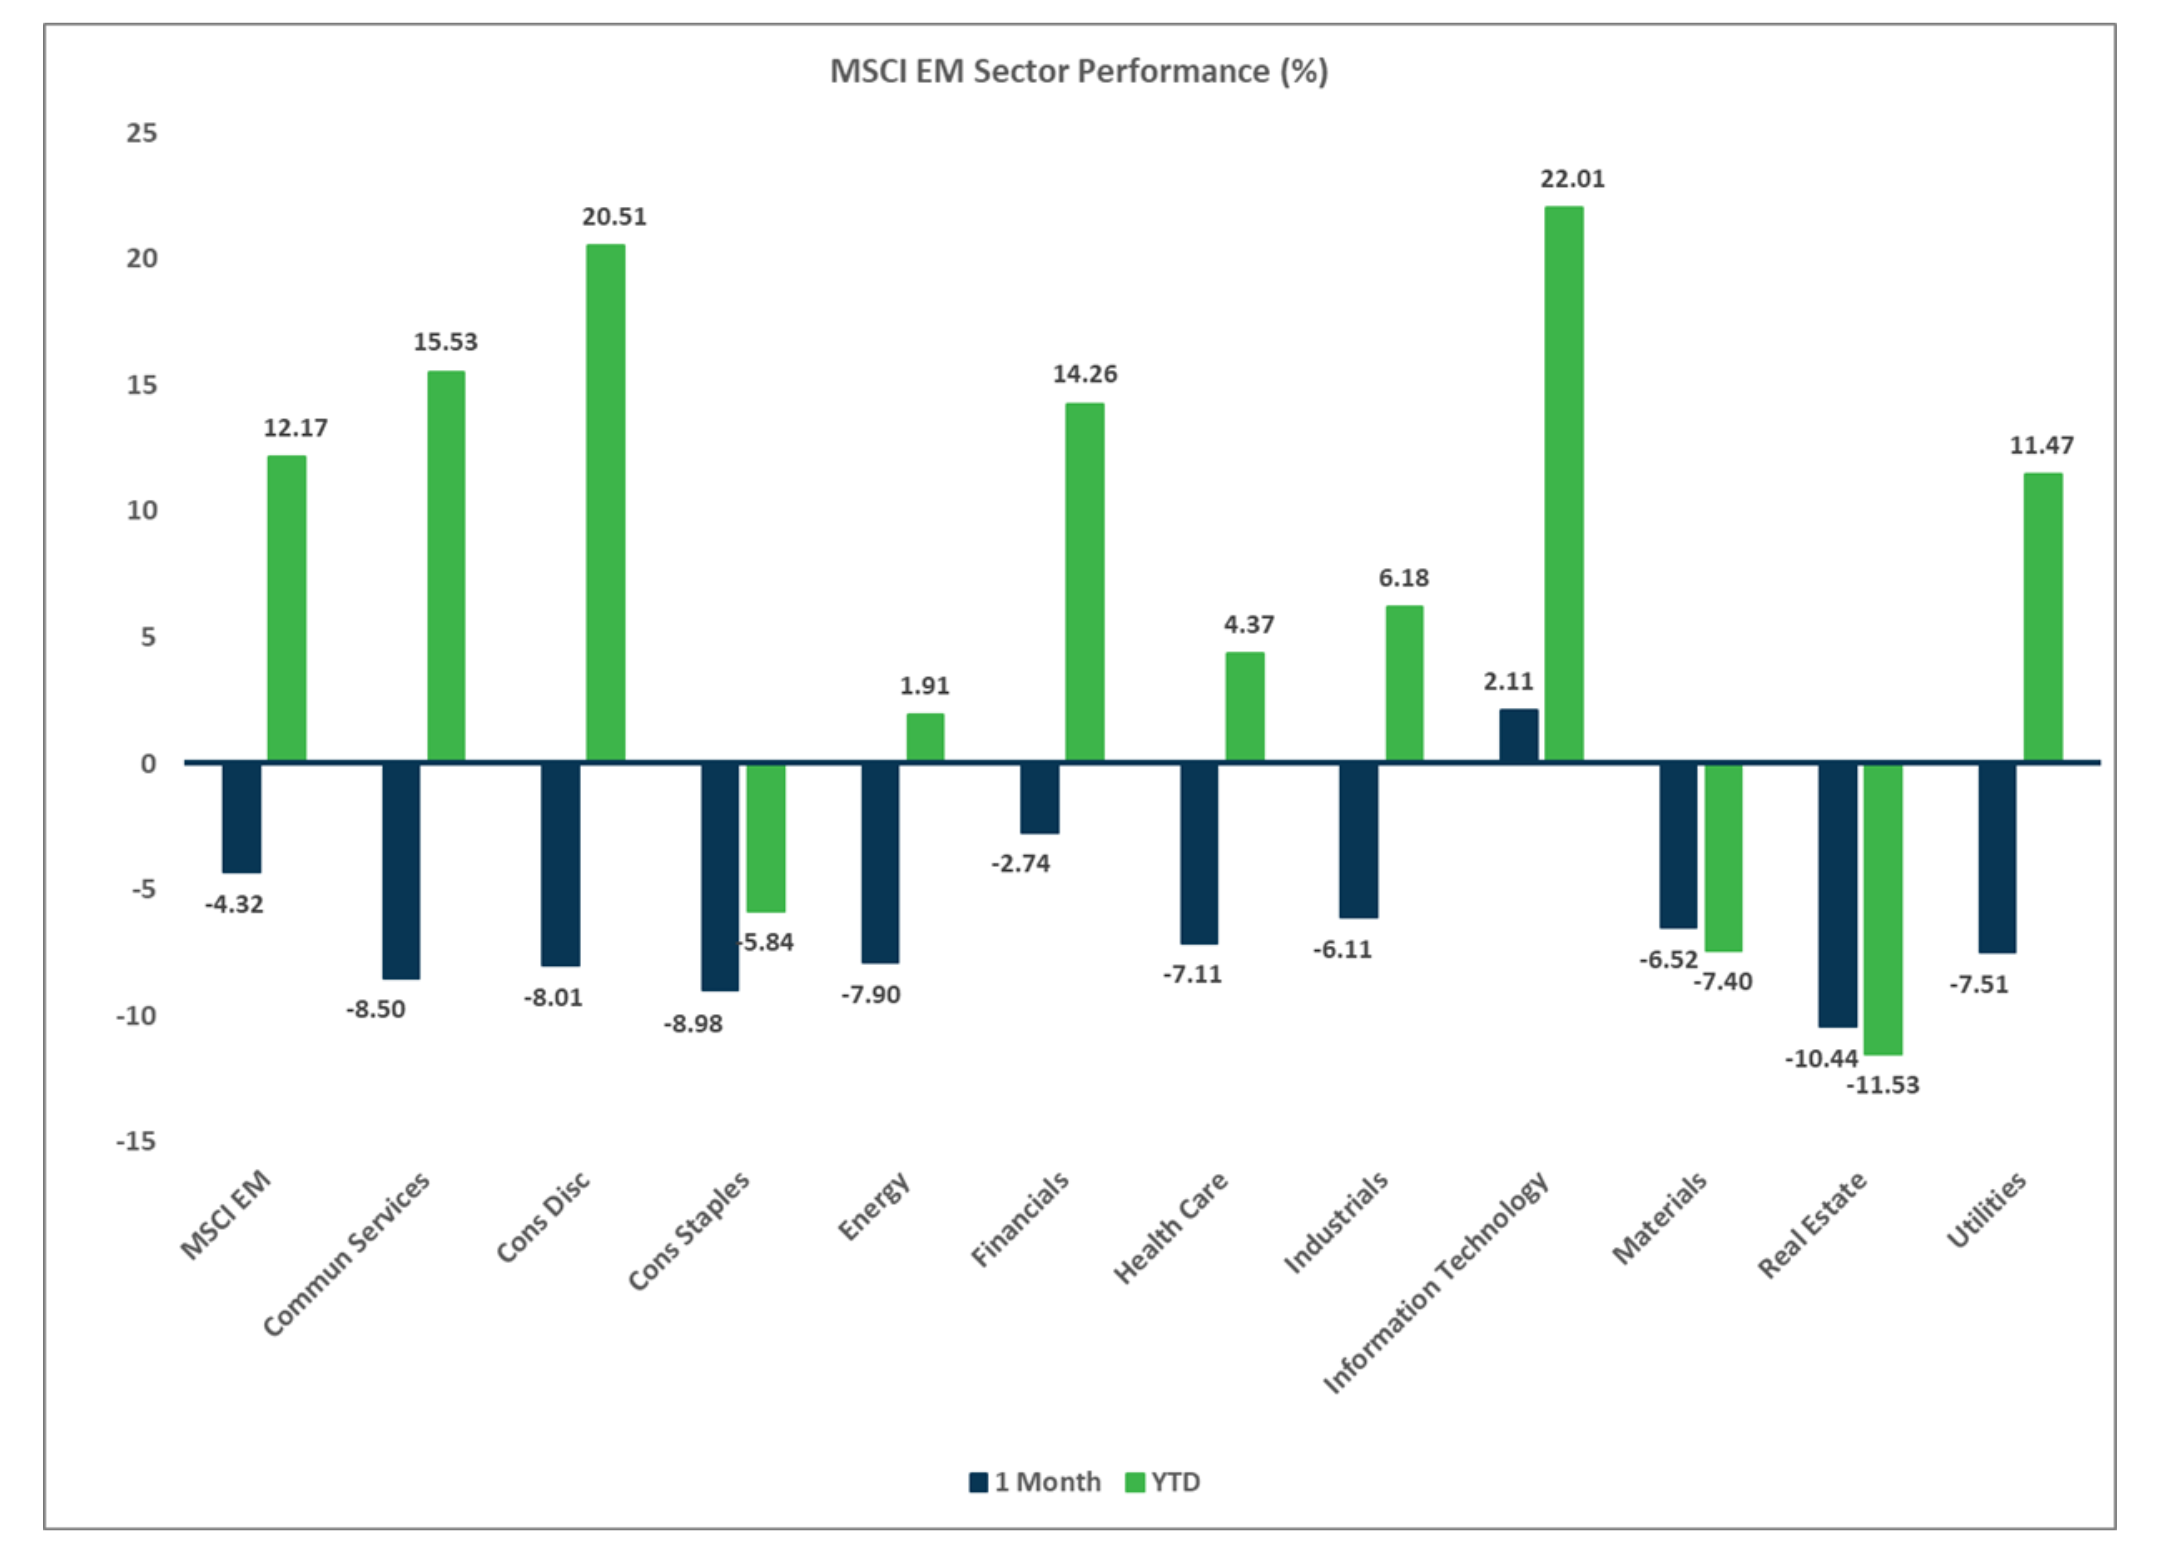
- Emerging market (EM) equities held up a bit better than the EAFE, but losses were across all regions, styles and market caps.
- The strong USD cost EAFE investors 384 bps of performance in October and 157 bps for EM investors.
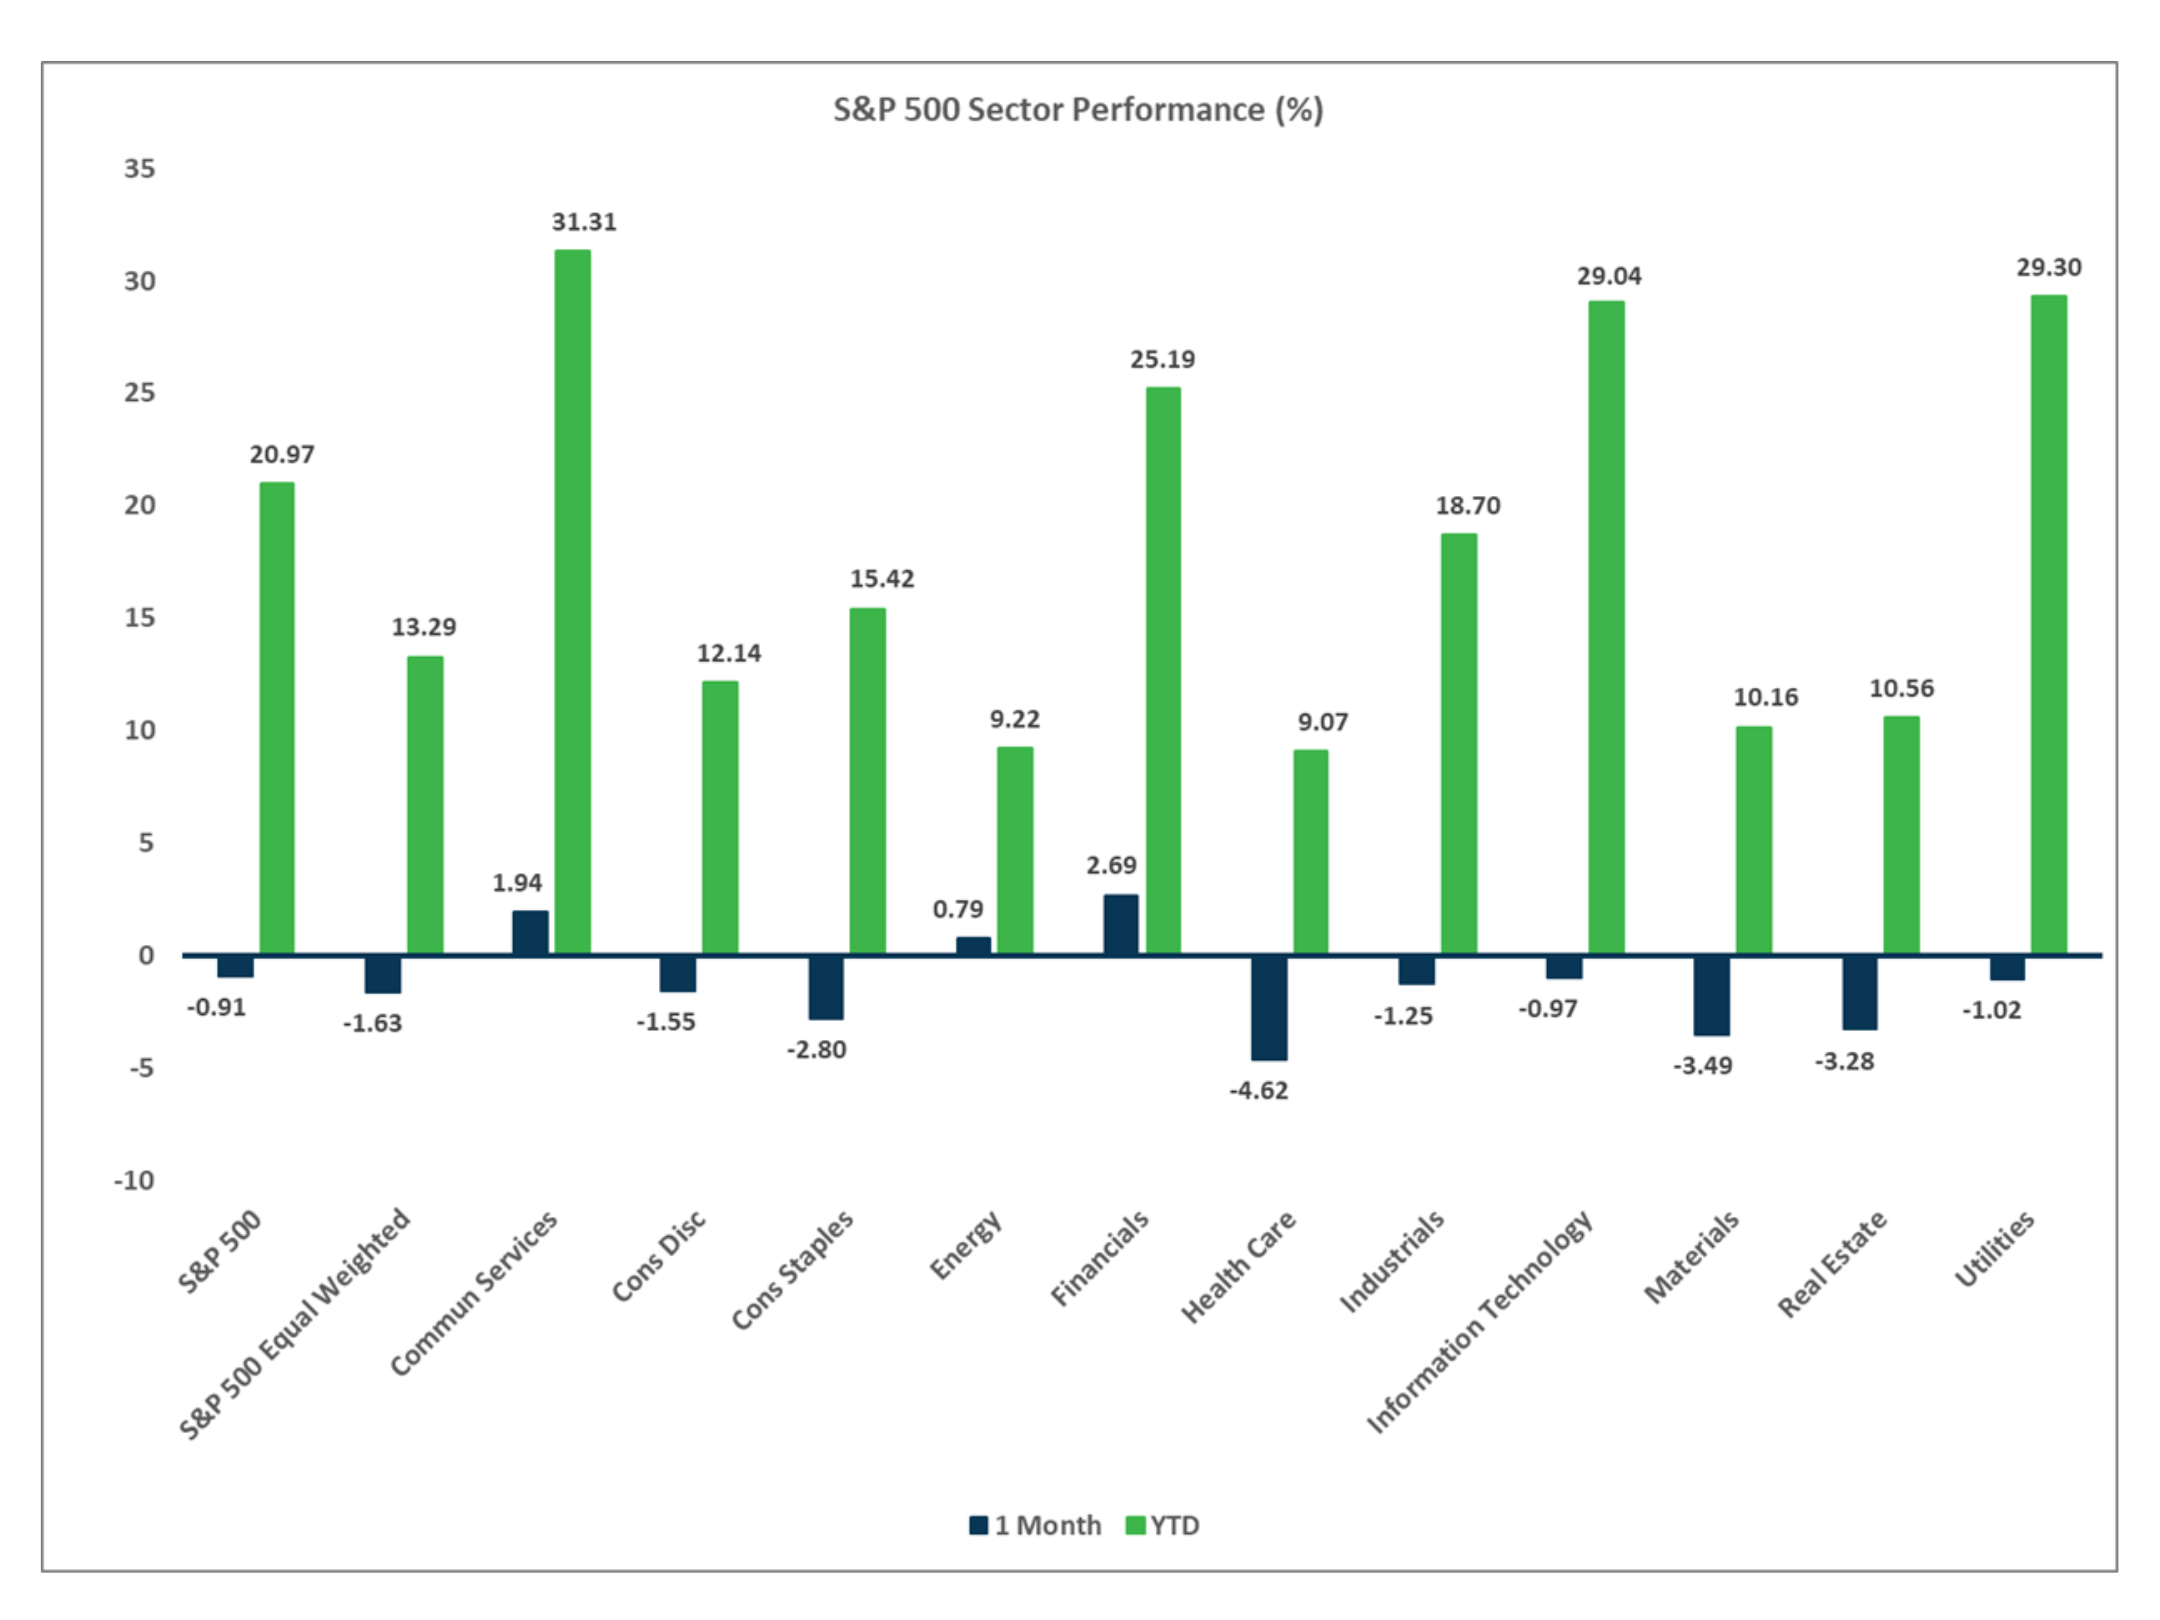
Sector Performance - S&P 500 (as of 10/31/24)
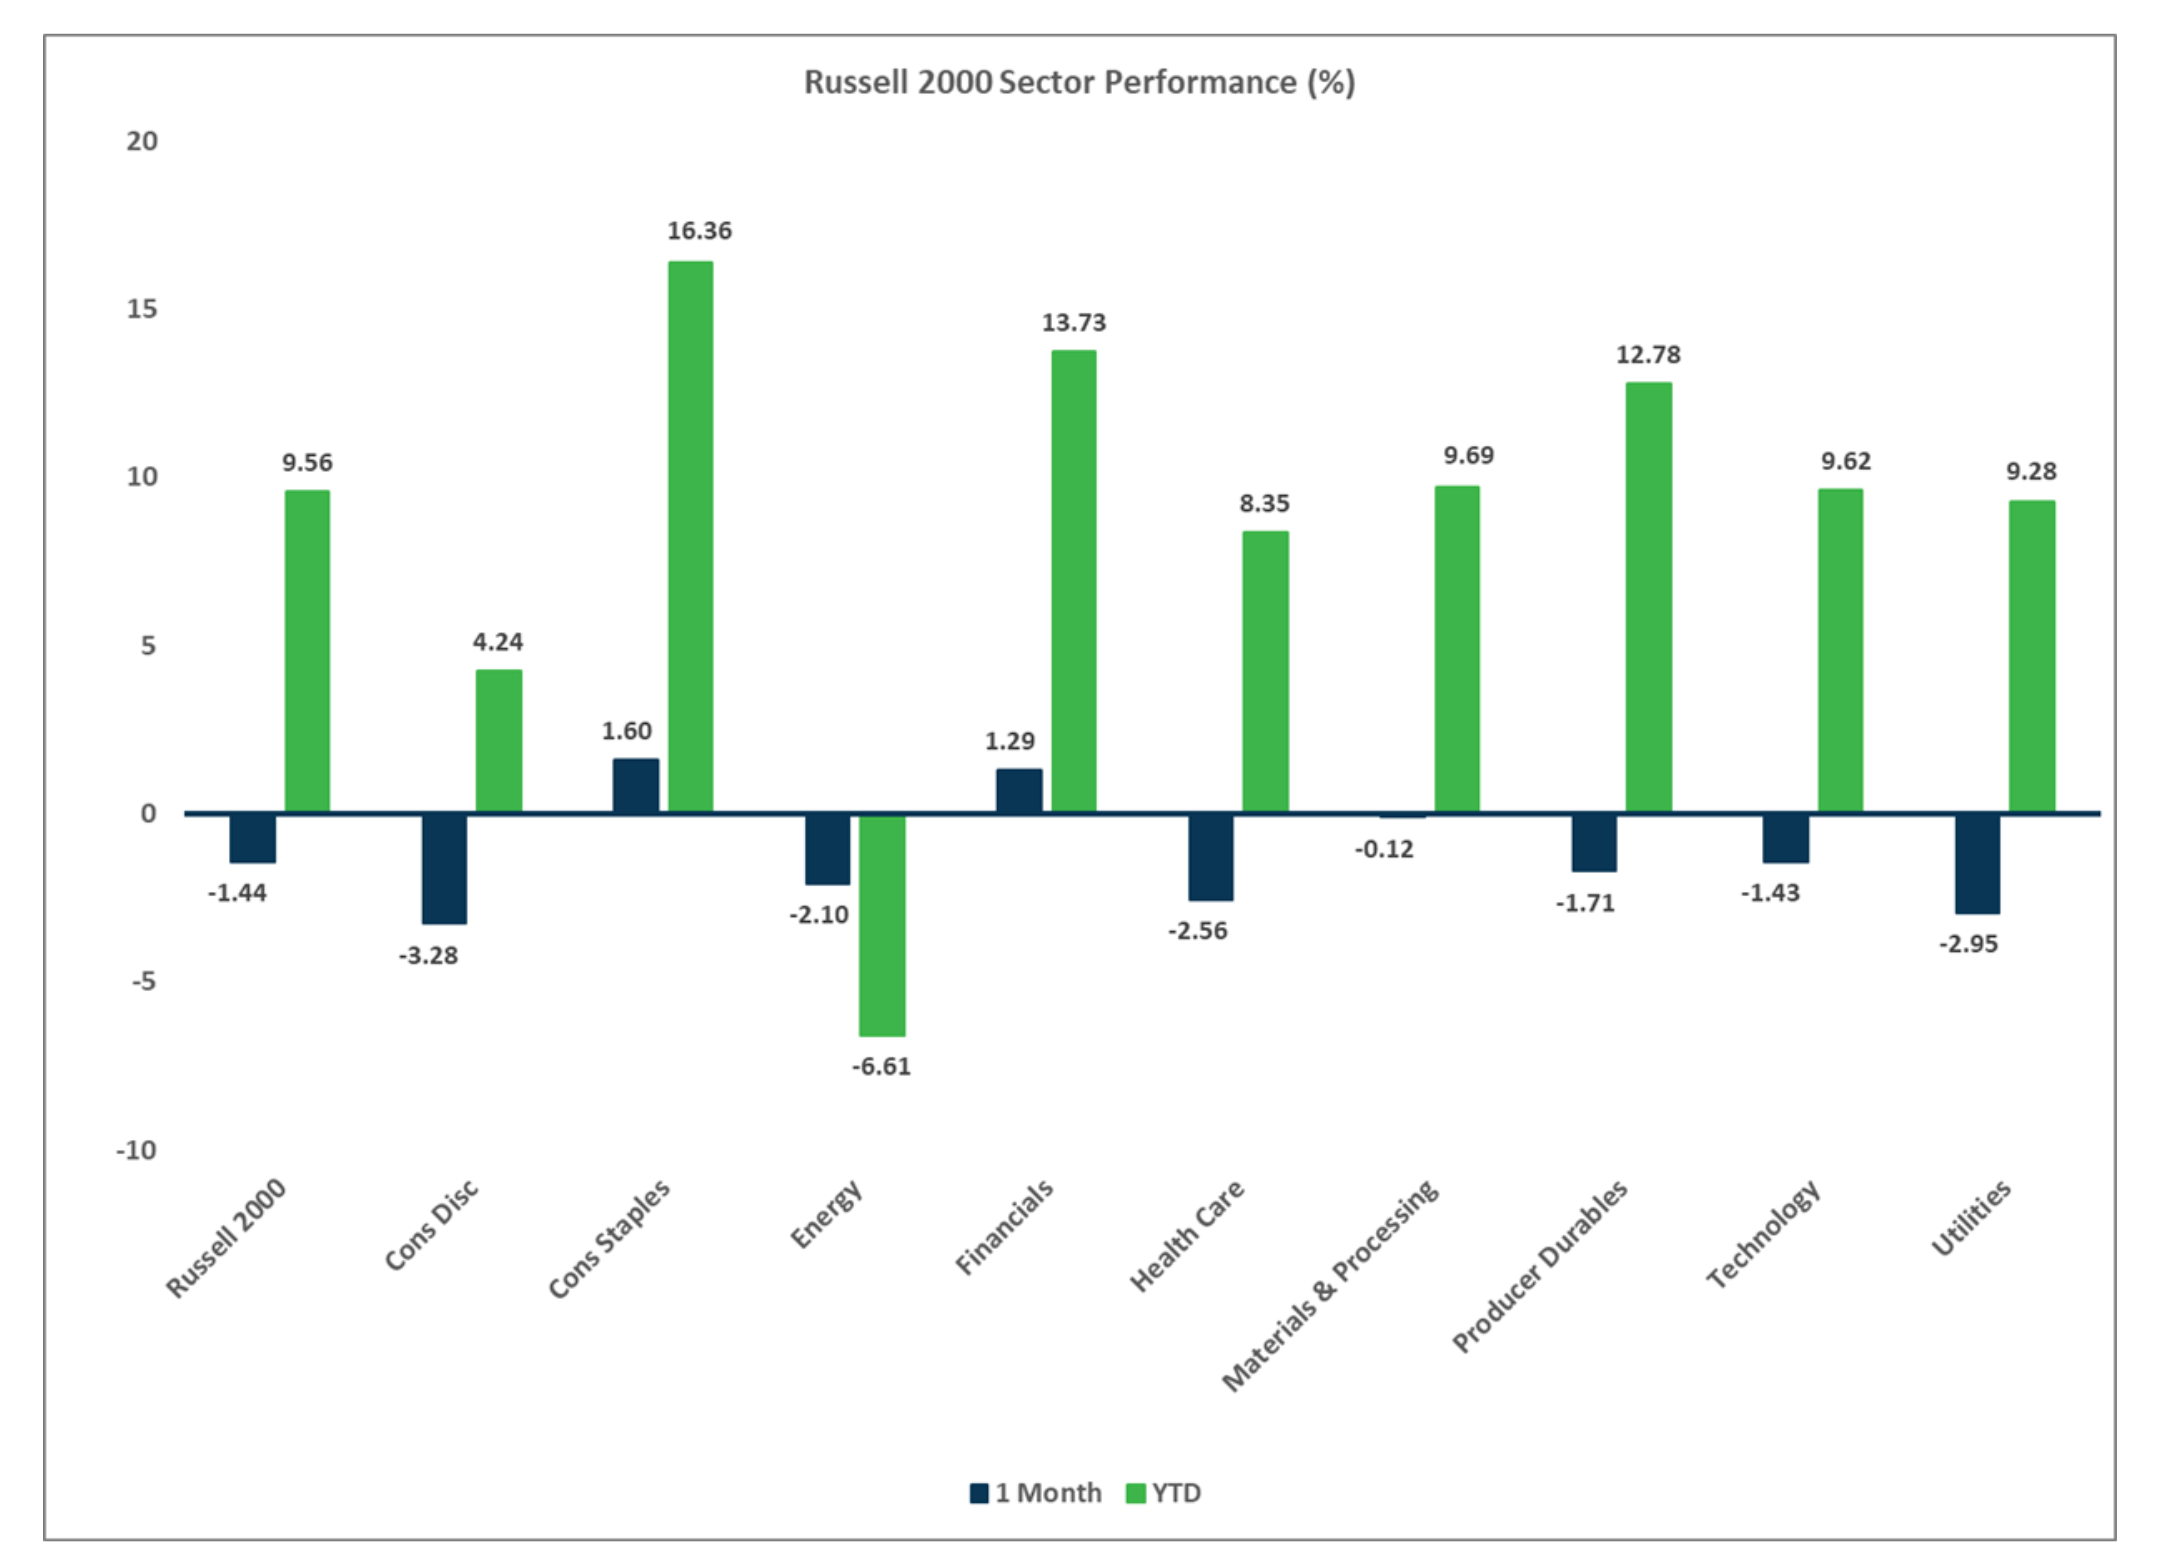
Sector Performance - Russell 2000 (as of 10/31/24)
Sector Performance - MSCI EAFE (as of 10/31/24)
Sector Performance - MSCI EM (as of 10/31/24)
